Silver seems to be exceptionally good at taking as few people along for the ride as it can. This can be frustrating for silver investors, but is great for the health of the long term bull market in silver. The only way bull markets sustain themselves over the long term is to rebalance sentiment along the way, to prevent overwhelming bullishness from extinguishing the long term rally. Silver bucks investors off its bull run by trading in the following three ways: First, it has long and flat consolidations that shake off investor confidence and eventually cause them to bailout of their positions, often at the wrong time. Second, when it does rally, it does so in a non-stop runaway train manner, right from the start to finish into a spike high. Third, once the spike high is over silver immediately has a big correction, temporarily wiping out a big portion of the previous gains.
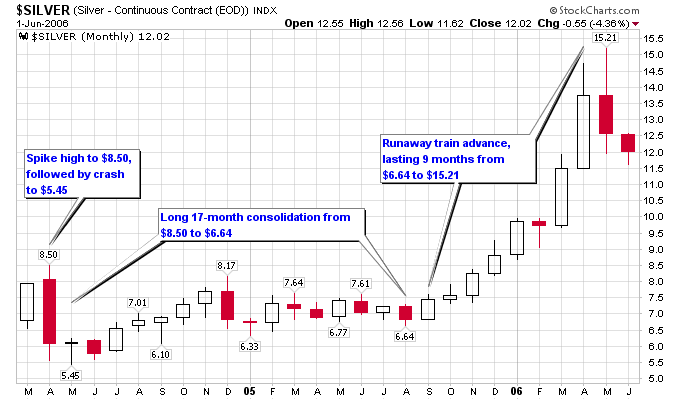
Let’s look at a few charts to get a better idea of how this process works. The first chart is a monthly chart of silver from April 2004 to May 2006. In April 2004, silver made a high of $8.50, after rallying from an October 2003 low of $4.75. This prior 6-month rally took silver 79% higher. After making the high at $8.50 in April 2004, silver crashed to a low of $5.45 in May 2004. In a manner of weeks this temporarily wiped out the 79% rally into a mere 15% rally, or taking an 81% chunk out of the rally. Demoralizing to say the least for those that didn’t lock in some gains at that $8.50 high.
Silver then went on a long 17-month consolidation, where it meandered back and forth in the $6-$7 range. Long consolidations like these are essentially a staring game between the market and investors. Investors typically blink first, and start looking for other sectors that are performing, rather than keep capital parked in something that is going nowhere. At the end of the 17-month consolidation, silver was down 22% from its $8.50 high to $6.64.
After the drawn out consolidation, silver had made enough non-believers once again to go on a massive rally. Silver went on a 9-month rally from $6.64 to $15.21, for a 129% gain. In typical fashion for silver it was only down 1 month during that rally, and during that down month it recovered most of its losses. This was another exceptional run for silver.
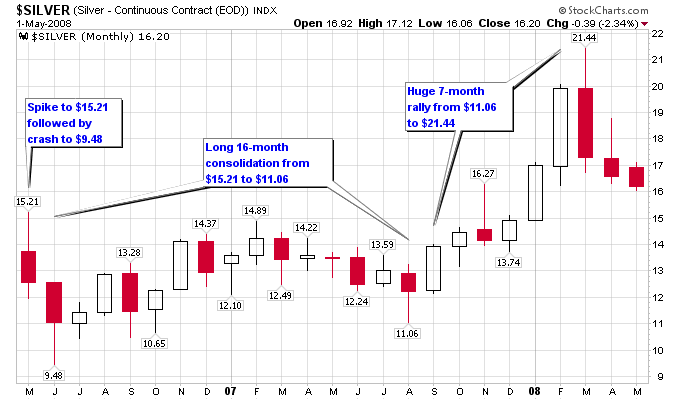
The exact same process repeated again after the May 2006 high at $15.21. Silver had an initial violent pullback off the spike high, taking it all the way down to $9.48. This temporarily turned the 129% rally into a 43% rally, or 67% off the rally peak. Next silver drifted into a 16-month consolidation, and at the consolidation end low point, silver was down 27% from $15.21 to $11.06. Finally silver went on another huge run, again with only 1 down month during a 7-month rally from $11.06 to $21.44, for a 94% gain.
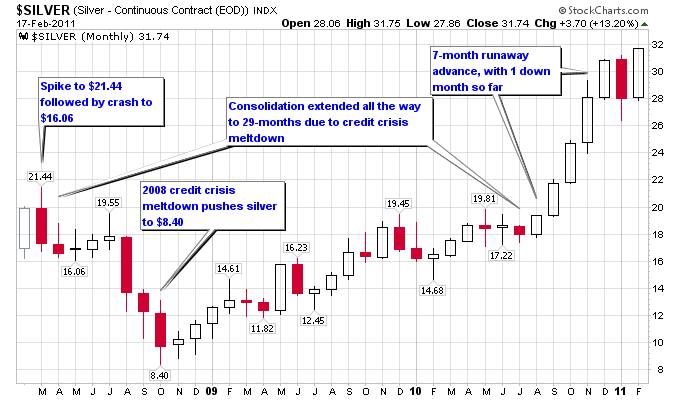
Now we get to the current picture in silver with the next chart. Silver again followed the same pattern as the previous two instances, except this time the 2008 credit crisis created a secondary low point after the initial spike low off of the high at $21.44. Since silver had more ground to recover off this secondary low, the consolidation was extended all the way to 29-months. Silver also took on a different pattern during this consolidation, forming more of a cup and handle formation instead of a trading range like the previous two instances.
Although silver recently had a down month in January, it has recovered to a new high so far in February. This is a good sign that silver could be in rally mode still, and not ready for another long multi-month consolidation. Whatever the future holds for silver, it will do its best to take as few people with it as it can.


