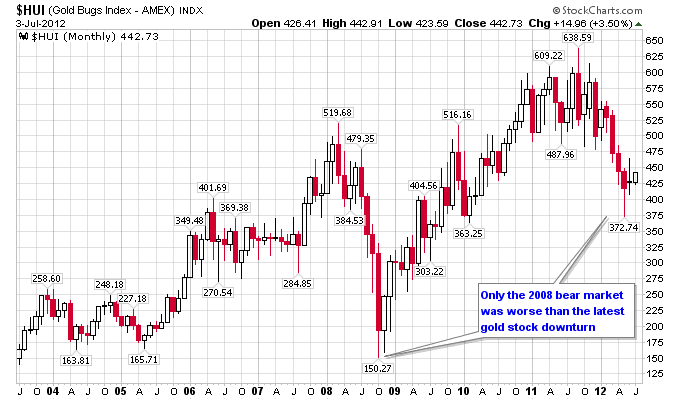
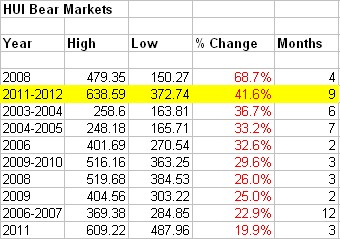
It’s been a rough time recently for gold and gold stock investors. The last nine months has been the second worst cyclical downturn in gold and gold stocks during this long term secular bull market for gold. The next chart shows how brutal this recent correction has been:
This bear market was not only the second worst in percentage loss, but also the second longest in time duration:
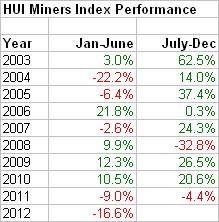
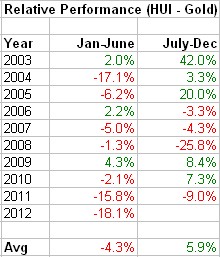
If that’s not bad enough, it’s actually been over 1.5 years now since gold stocks have made and held onto any gains. After closing the year at 573 in 2010, the HUI Gold Bugs Index made 4 attempts during 2011 to takeout the 600 level, and all 4 attempts failed. The next chart shows the HUI’s performance since 2003, and notice how 2011 was the first year where the HUI had a down year the entire year. This was then followed by the first half of 2012 where the HUI had it’s third worst half year loss of this bull market!
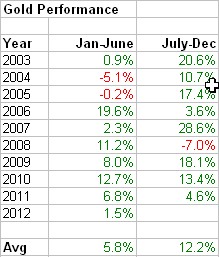
Gold meanwhile gained more than 11% in 2011, and muddled through the first half of 2012 with a small gain. In reality gold’s correction off of it’s 2011 top has been extremely orderly, another example of how consistent this bull market has been.
Here’s where it gets especially brutal for gold stock investors. Instead of leveraging the gains in gold in 2011 and the first half of 2012, the HUI drastically underperformed gold at nearly a double digit clip for the entire period! The underperformance to start the year in 2012 was also the second worst of this bull market.
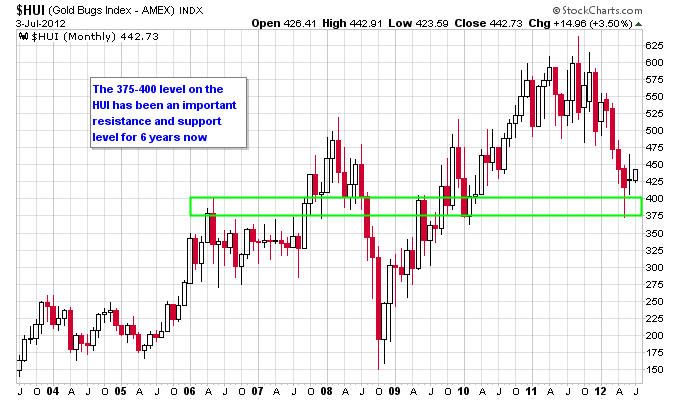
After making a bottom in the middle of May, there are encouraging signs this gold bear market has run its course. First the recent successful test of the 375 level on the HUI that was rejected for higher prices was a logical long term support level. The 375-400 level was major resistance for 2006-2007, then became support briefly in 2008 before the financial crisis hit. Then in 2009 that level was brief resistance again before the HUI broke above it in late 2009, then tested that level as support in early 2010 and didn’t look back after that. Now that this 2012 correction has once again retested that level and soundly rejected it (at least so far) it could prove to be the final test for that level for this bull market.
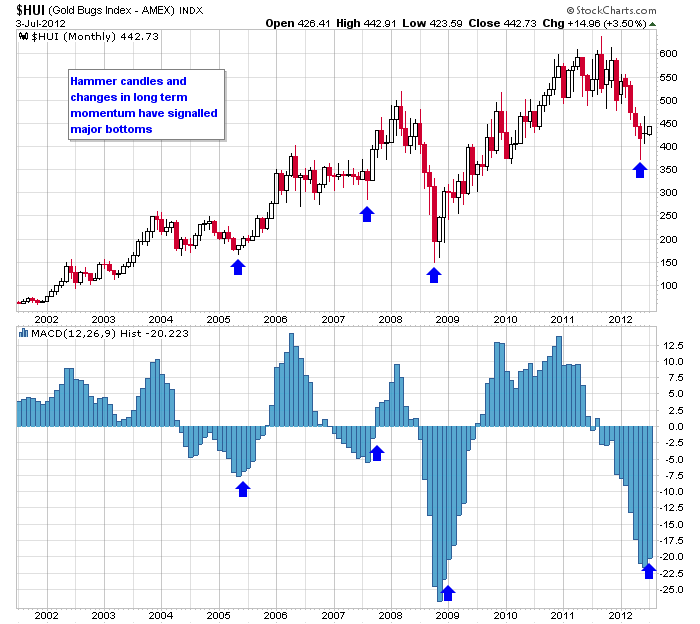
Long term momentum has gradually started shifting back to the upside along with the recent monthly hammer candle. Note also that the HUI staged powerful rallies in 2005, 2009, and 2010 that actually started in July, and didn’t have to wait for the full completion of the typical summer doldrums.
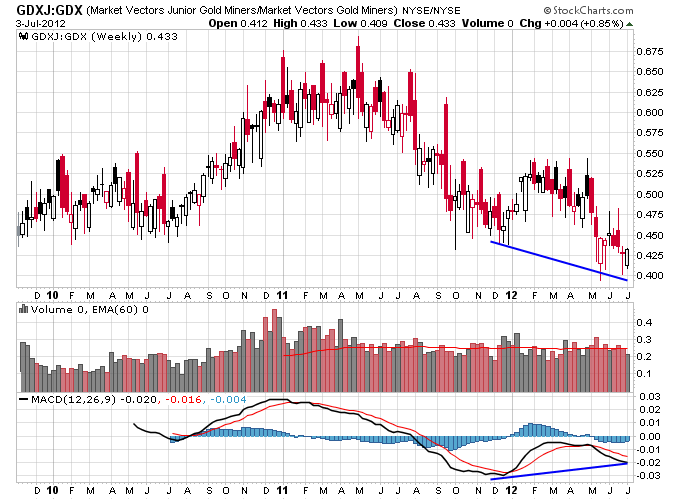
In the risk pyramid in the precious metals space, there is a notable positive divergence in riskier assets. Junior gold stocks are displaying positive momentum vs. senior gold stocks.
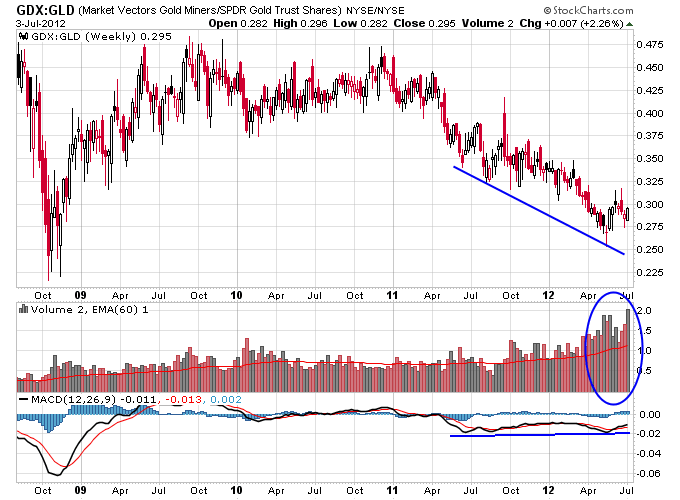
Senior gold stocks are showing a positive divergence to gold, and also a large increase in buying pressure vs. gold when comparing relative volume.
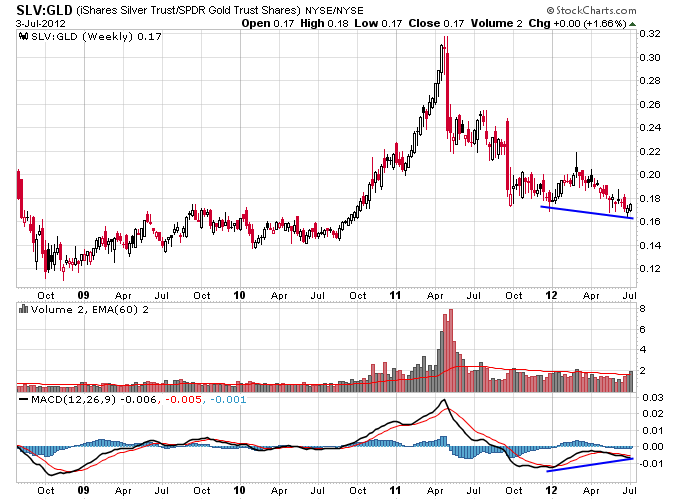
Silver is showing a positive divergence to gold.
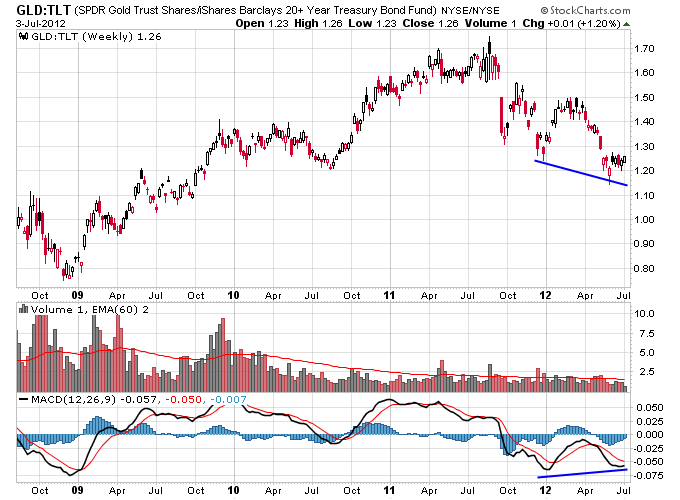
And gold is showing positive divergence to bonds, which is notable as bonds have soared since early 2011.
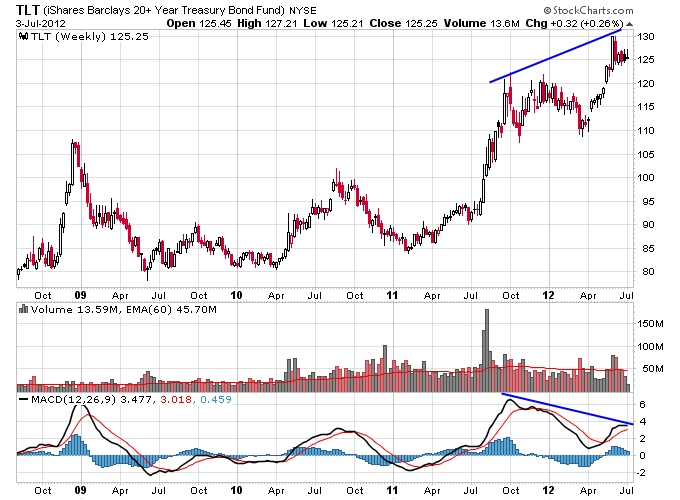
Speaking of bonds, note the negative divergence in momentum on the recent high, and also the lack of volume on this recent rally compared to the rally in 2011.
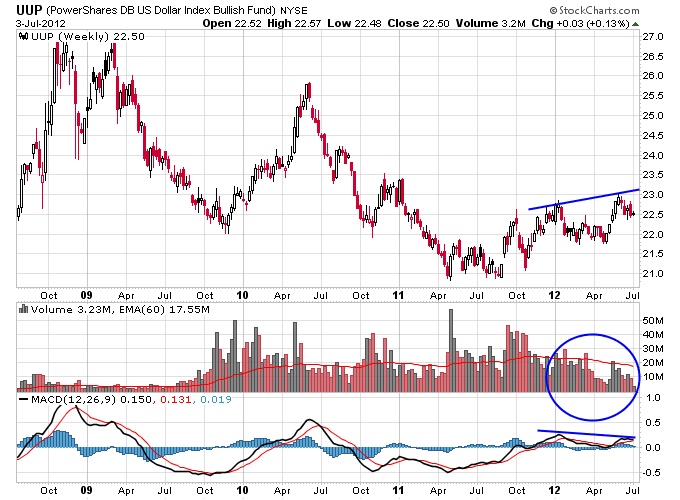
The dollar ETF UUP is also showing a negative divergence in momentum, and lack of upside volume on the recent rally.
In conclusion it appears as if the gold sector is gradually coming to the end of the recent bear market, given the technical evidence and severely bearish sentiment. A top in paper assets (the dollar and bonds) would probably be the final nail in the coffin for this gold correction.
Follow me on Twitter: @nextbigtrade
The original article and much more can be found at: https://www.nextbigtrade.com
The views and opinions expressed are for informational purposes only, and should not be considered as investment advice. Please see the disclaimer.
