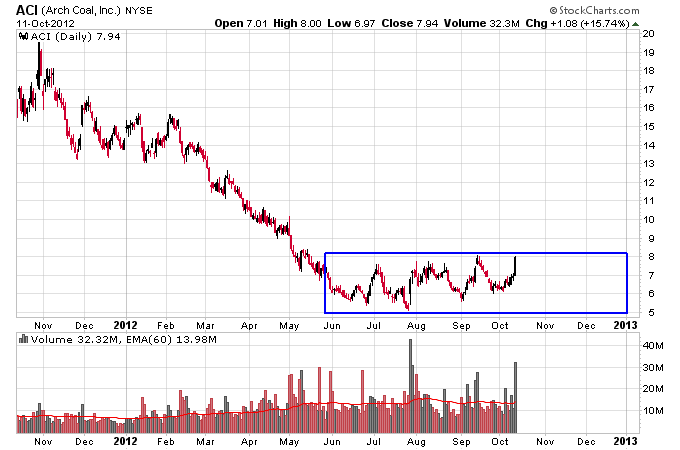
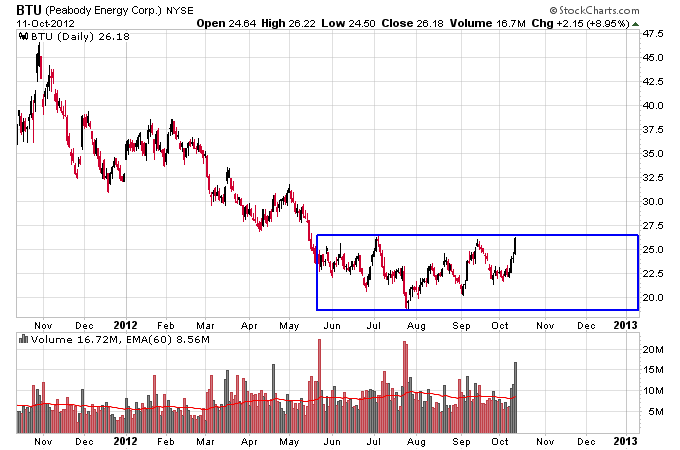
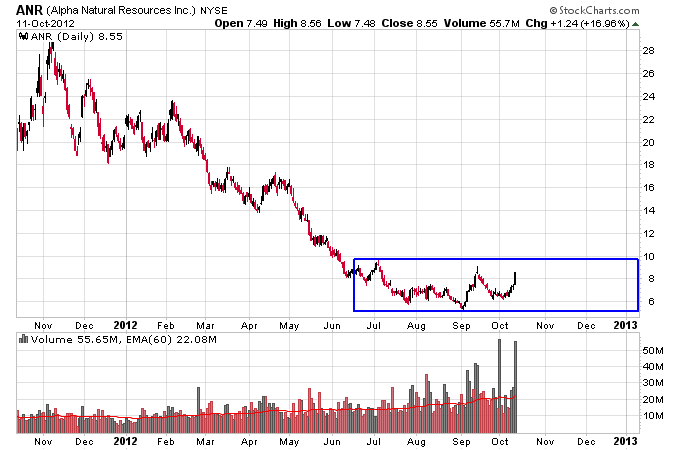
The coal sector has been absolutely decimated over the past two years. Low natural gas prices and a slowdown in China have been two of the main driving forces behind the decline. But no bear market lasts forever. Just like the gold mining sector earlier in the year, when the fundamentals and sentiment look the worst, often the charts start to display a different story. Sometimes it helps to just pay attention to the price action and ignore the noise.
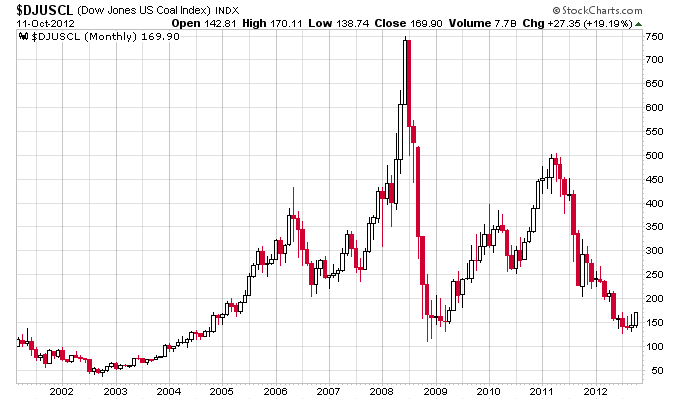
First let’s take a big picture view of the coal sector. To do this we’ll use a monthly chart of the Dow Jones U.S. Coal Index. A few things stand out to me on this chart. First is the fact that we are coming off of the second worst bear market in coal over the last 10 years. The coal sector lost about 75% of its value during this bear market! The only bear market that comes close to that is the bear in 2008 that demolished coal 85% in 5 months. That was probably one of if not the most crushing blows to any market from the devastating 2008 stock market panic. But in reality coal stocks went parabolic before the 2008 devastation, so they were especially vulnerable during that bear market apocalypse.
The second thing that stands out to me is just how boom and bust the coal sector seems to be. Of course past price action does not necessarily have any impact on future price action, but as I’m about to show the extreme nature of this latest bust has also stretched the value of coal to other assets in the energy sector. And when inter-market relationships get stretched to extremes often a reversal takes place.
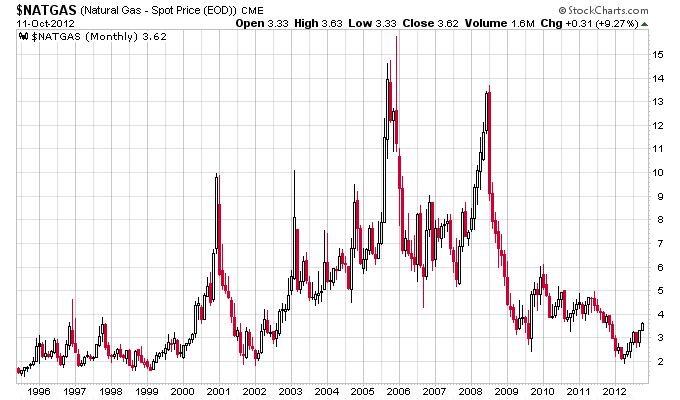
Now let’s bring up the subject of natural gas, a big driver of coal over the last year. I remember back in 2005 when natural gas supplies were tight, and natural gas was going straight up as winter started that year. I saw some price projections of natural gas into the 20s and 30s that winter. Now I bet if you told anyone that winter in 2005, that in 2012 natural gas prices would drop below $2 they would think you were crazy. But that’s exactly what happened. It’s a great example of how the impossible can happen in markets, which is why I’m an advocate of respecting and following the major trends.
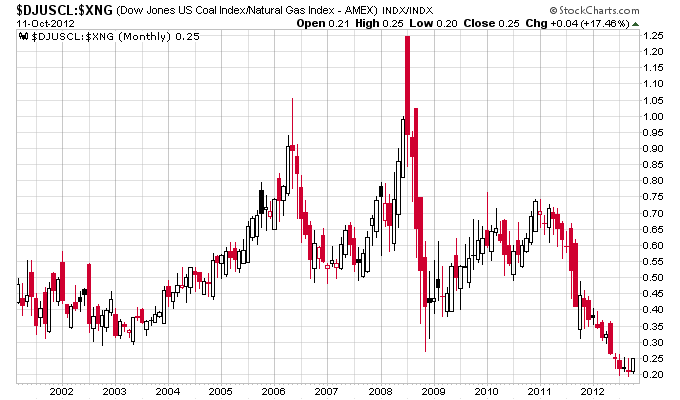
Fast forward 7 years later from 2005, and now we seem to have tons of natural gas, and no more need for coal. Recently natural gas made a 10-year low in price. This low has actually had a more significant impact on coal stocks than on natural gas or oil stocks according to inter-market relationships. Coal vs. gas stocks are sitting at all-time lows, since the U.S. Coal Index chart only goes back to 2001.
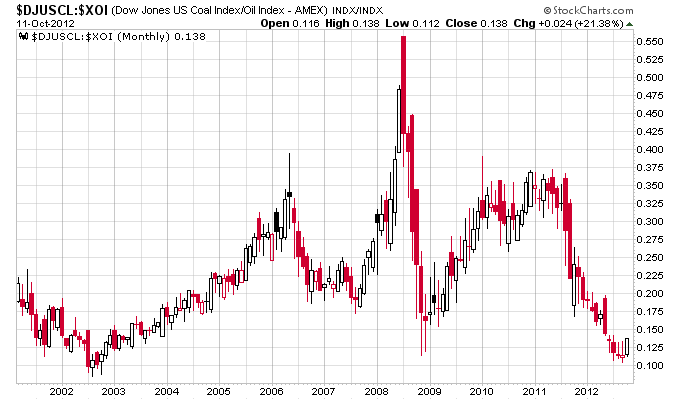
Coal vs. oil stocks are sitting right at the 2008 lows, which besides 2008 stretch all the way back to the 2002-2003 time frame. The market appears to be just about as bearish as it has gotten on coal over the past decade, especially when compared to oil or natural gas.
What looks particularly interesting right now is the action in coal stocks. Coal stocks had a big day on Thursday, but more importantly they have formed a multi-month Stage 1 base, and there has been a notable increase in volume over the past couple of months indicating accumulation is going on.
At this point what we want to see is the coal sector start to move up in unison, indicating a change in trend and a new bull move beginning in this market. This action reminds me of what was discussed in a great book about Jesse Livermore, entitled “Jesse Livermore: World’s Greatest Stock Trader.” To quote from the book:
“He had no interest in finding a bargain or cheap stock. He was not a bottom fisher. He was a trend follower. He was only interested in following the trend, what he called the line of least resistance. He was one of the first true momentum players.
He now knew it was not whether the market or a stock would turn, but exactly when it would turn—timing was everything. But he also realized that no one could call or predict exactly when the market would turn or what a stock would do. So, Livermore developed his probing, or testing the market, approach.”
The next series of charts are what I’ve dubbed hypothesis charts after the Livermore testing approach. Basically the hypothesis is for a confirmed Stage 2 breakout we want to see an increase in volume, and the stocks in the sector move higher together. This confirms the hypothesis that a change in trend is occurring in this market. If the hypothesis fails, the stocks would stay in the base and possibly even breakdown again. I’ve extended the chart out a few months for the price action and volume in the future to either confirm or invalidate the hypothesis, based on what happens in the future.
The bottom line is coal has been in a bear market, but dynamics in the coal market could be changing, as evidenced by recent price action. I’ll provide an update on this market over the next few months, and we can see how the charts have played out.
Disclosure: Long ANR
Connect with me on Twitter: @nextbigtrade
The original article and much more can be found at: https://www.nextbigtrade.com
The views and opinions expressed are for informational purposes only, and should not be considered as investment advice. Please see the disclaimer.
