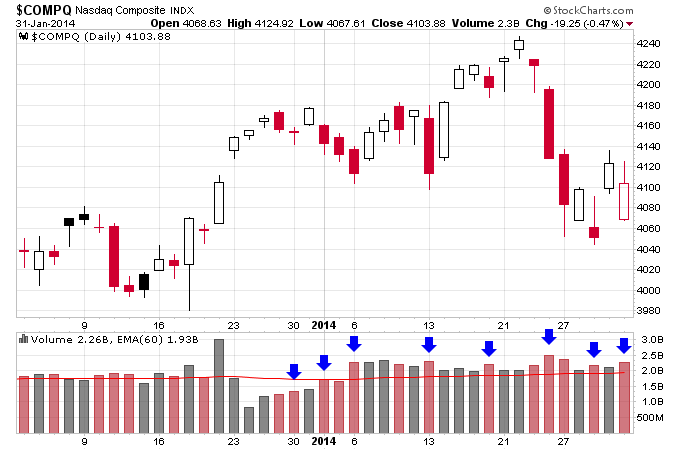
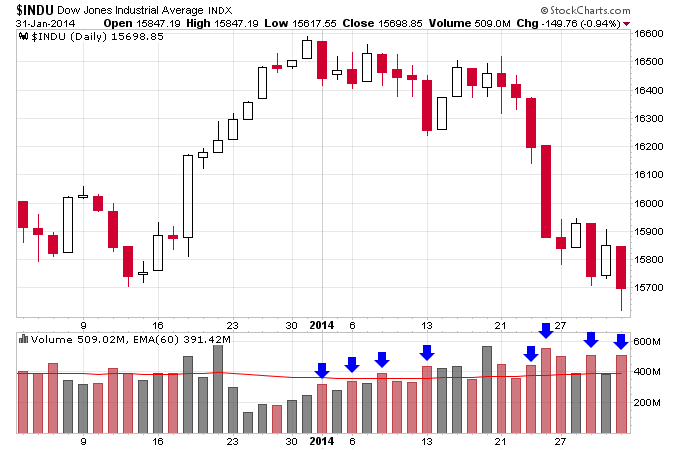
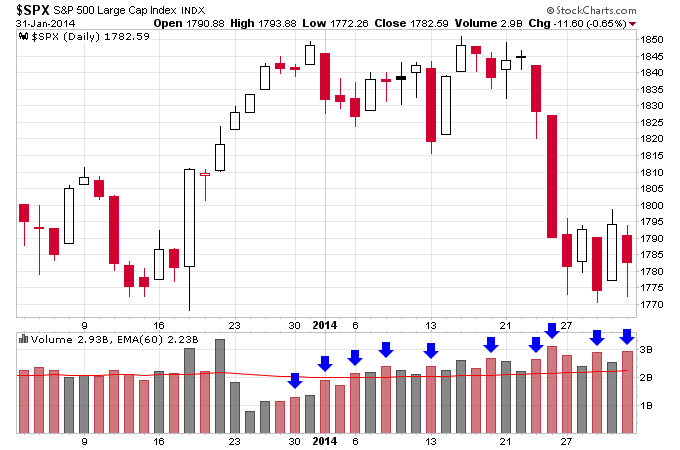
The following three charts pretty much sum up what happened in January for the stock market. Stocks were sold. Notice all the distribution days piling up on the major indexes. Investors Business Daily is now in “market in correction” mode.
It’s interesting to note the contrast in sentiment between December 2012 and December 2013 and how it affected the markets. As I discussed in a previous article in December 2012 CNBC had everyone on edge about the fiscal cliff, but all that pessimism instead produced a strong rally in January 2013. Contrast that with December 2013 where an article on CNBC was titled “Embrace The Selloff”, where instead of being scared of a pullback like in December 2012 now the author argued a pullback was “welcome”. Sentiment was definitely the polar opposite in December 2013 as huge gains led to excessive optimism in the market. And this has ultimately led to a weak January 2013 as too many bulls inevitably is what puts an end to market rallies.
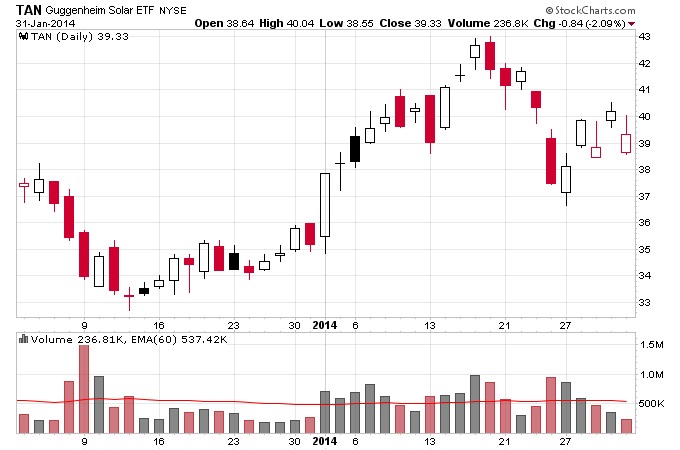
Rotation out of stocks has produced a bounce in the dollar and bonds. The dollar ETF UUP, as well as IEF and TLT have moved back into a Stage 1 base. The big winners in January were some of the beaten down sectors of 2013. Junior gold miners (GDXJ) and coffee (JO) both gained more than 10%. Uranium (URA) continued to rally as many uranium miners are breaking out on volume. Solar stocks held up well despite the market pullback, and look poised to continue to rally in 2014. As I noted here the solar sector broke out of a Stage 1 base in early 2013 so the solar bull market is still fairly young.
Connect with me on Twitter: @nextbigtrade
The original article and much more can be found at: https://www.nextbigtrade.com
The views and opinions expressed are for informational purposes only, and should not be considered as investment advice. Please see the disclaimer.