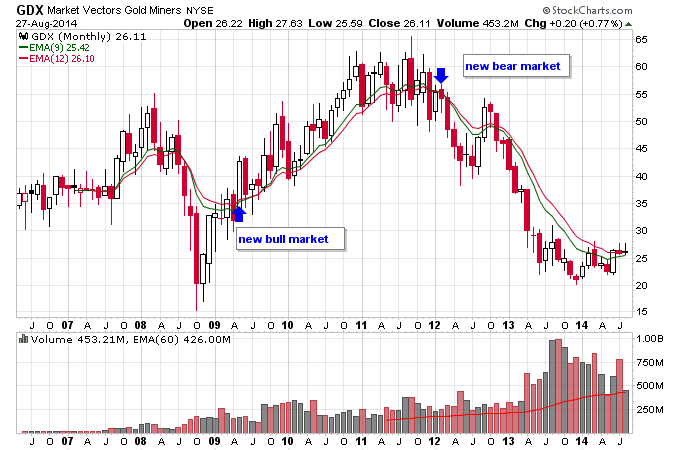
I’m introducing a new report to the site called the “Bull Bear Report”. This is a simple trend following model using a moving average crossover system to determine if a market is in a bull market or a bear market. The moving averages I am using are the 9-month EMA and the 12-month EMA. When the 9-month is above the 12-month, the market is in a bull market. When the 9-month is below the 12-month, the market is in a bear market. The report contains how many months there has been since the last crossover, which provides a duration for the bull or bear market. This is important because it helps identify markets that are late in bull or bear markets, or early in new bull or bear markets. The idea would be to be skeptical of markets that have been in bull or bear markets for a long time (the rough average for a cyclical bull market is 3-5 years and a cyclical bear market 1-3 years) and be interested in markets that are potentially entering new bull or bear markets. This system works well for trending bull and bear markets, as you can see in the chart of GDX below. GDX had a fairly clean bull signal in 2009 and a bear signal in early 2012 without a lot of crossover.
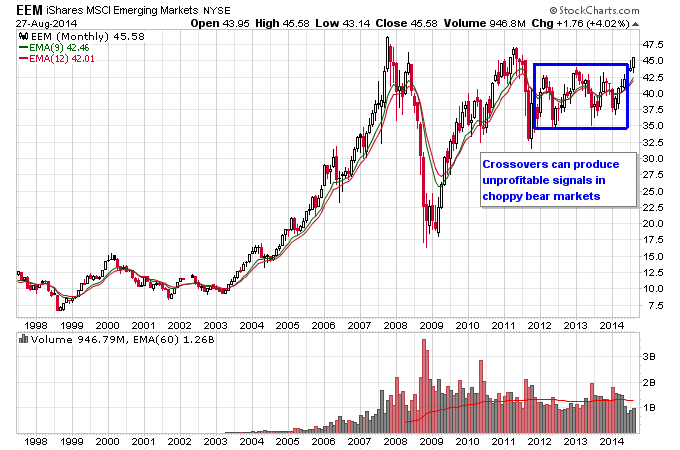
For choppy bear markets this system does not work well, such as what happened with EEM between 2012 and 2014. Multiple false signals in both directions. Choppy markets are the nemesis of trend followers.
In the current report, we can see that the major indexes such as the Nasdaq, S&P 500, and Dow Jones are all in near 5-year bull markets. Major market sectors are approaching 5 year bull markets too. I’m not surprised that things like energy have been catching up this year because as you can see on the report they were not as deep into their bull markets as other major markets. On the early bull market side we have things like Palladium, Coffee, Emerging Markets, and Bonds. On the bear side most of the things in bear markets are commodities related. Notice that copper and gold miners are now almost in 3-year bear markets. The GCC commodities index actually just threw a whipsaw signal swinging back to a bear market over the last couple of months. So the overall picture is one of stock indexes and sectors in later stage bull markets and commodities in later stage bear markets. Bonds and some commodities and emerging markets are in early bull markets. I will publish these results each month to capture trend changes with the idea of finding early bull markets to profit from.
Bull Markets
| Ticker | Months | Chart |
| SHY | 133 | Chart |
| XRT | 61 | Chart |
| QQQ | 60 | Chart |
| XLK | 60 | Chart |
| XLY | 59 | Chart |
| XLP | 59 | Chart |
| DIA | 58 | Chart |
| XLV | 58 | Chart |
| SPY | 57 | Chart |
| IWM | 57 | Chart |
| IYT | 57 | Chart |
| XLI | 57 | Chart |
| IYR | 56 | Chart |
| XLU | 54 | Chart |
| XLE | 47 | Chart |
| XHB | 33 | Chart |
| XLB | 32 | Chart |
| IYZ | 31 | Chart |
| XLF | 30 | Chart |
| PALL | 21 | Chart |
| OIL | 13 | Chart |
| FXE | 13 | Chart |
| FXF | 12 | Chart |
| FXB | 11 | Chart |
| EEM | 5 | Chart |
| JO | 5 | Chart |
| IEF | 4 | Chart |
| TLT | 4 | Chart |
Bear Markets
| Ticker | Months | Chart |
| JJC | 35 | Chart |
| GDXJ | 33 | Chart |
| GDX | 30 | Chart |
| CANE | 23 | Chart |
| FXY | 22 | Chart |
| SLV | 21 | Chart |
| PPLT | 19 | Chart |
| WEAT | 19 | Chart |
| SIL | 19 | Chart |
| FXC | 19 | Chart |
| GLD | 18 | Chart |
| CORN | 17 | Chart |
| FXA | 16 | Chart |
| UUP | 12 | Chart |
| GCC | 2 | Chart |
| SOYB | 1 | Chart |