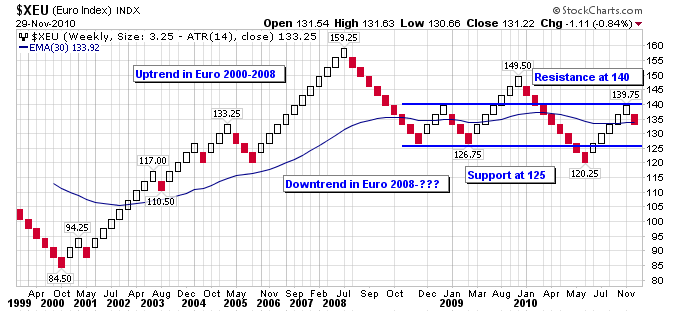
Renko charts are often useful in identifying the longer term trend because they remove short term volatility in a stock chart. The Euro has been a particularly volatile currency over the last few years due to the financial problems of the PIIGS countries. Below is a weekly renko chart of the Euro:
The chart shows that the long term trend in the Euro switched from an uptrend to a downtrend in 2008. The downtrend since 2008 has been much more volatile than the previous uptrend, as the Euro has staged two large counter trend rallies within the downtrend. Currently the Euro has just hit a resistance level around 140, and has potentially turned down for another downleg. If the Euro goes on to break support at 125 and the previous lower low of 120 the longer term downtrend would be intact. To break the longer term downtrend the Euro first needs to move above resistance at 140.
