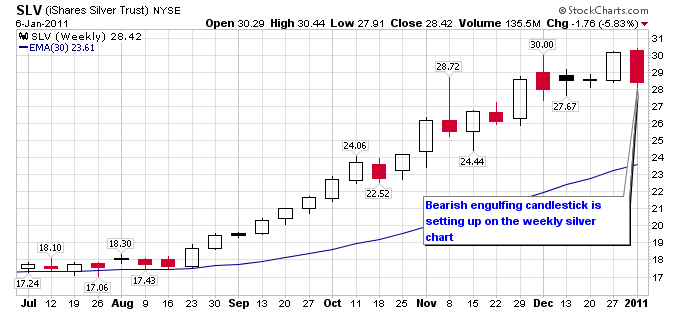
A number of bearish technical events have occurred recently in the silver chart. First, a bearish engulfing candlestick has formed on the weekly chart. A bearish engulfing candlestick is a reversal pattern, where buyers are overwhelmed by sellers and a new high is reversed into a new low.
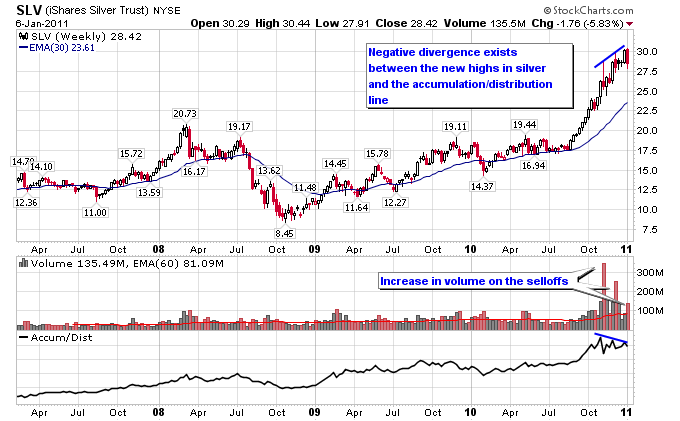
Second, there is a clear negative divergence between the new highs in silver and the accumulation/distribution line. This type of divergence can suggest that buying pressure is diminishing even as new highs are being made. If enough buying pressure disappears then sellers can take control and force a correction.
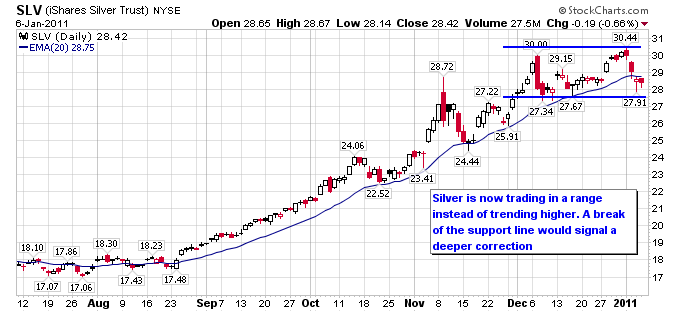
Finally, by looking at silver on a daily chart it is clear that silver is trading in a range instead of trending higher. A breakdown below the trading range support could signal a deeper correction, while a breakout above the range would be a continuation of the trend. Notice how silver has also broken below a moving average that has held as support multiple times during the recent rally.
Silver is clearly more at the mercy of sellers than it has been during past few months and should be monitored for a deeper correction.


