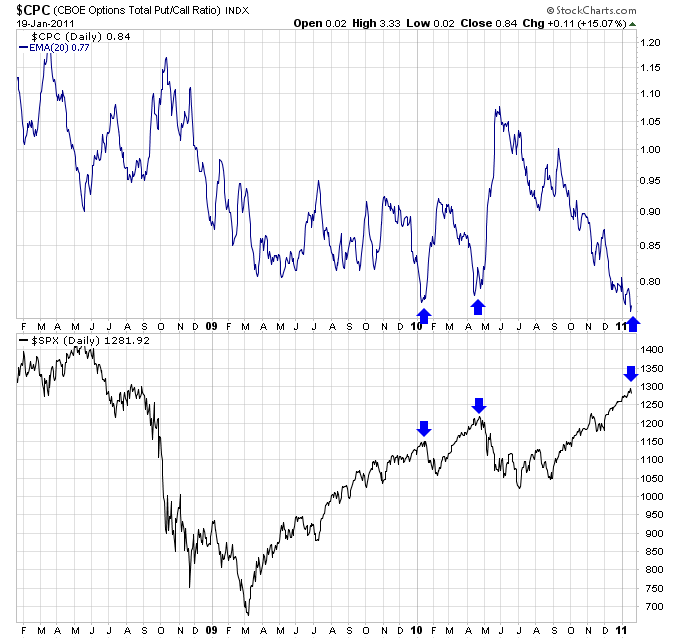
The chart below shows the 20-day moving average of the Put/Call ratio. The Put/Call ratio shows the difference in trading volume between Puts and Calls. A ratio above one means more Puts are being traded than Calls, and below one more Calls than Puts. This indicator is often used as a sentiment gauge since more Puts tend to get traded when investors are bearish, and more calls when they are bullish. Right now this indicator shows the complacency of the bulls in the market since the Put/Call ratio has fallen to an extremely low level. It’s actually at a level where that produced two of the larger corrections of 2010. Look for this indicator to start to trend back to the upside if the market continues to undergo a correction.
Related Posts
About Author: Justin
