The stock market was down again last week for the second week in a row, with the exception of the Transports, which closed positive for the week. The Transports had sold off more aggressively than the rest of the market the previous week, which probably contributed to their close higher. Commodities were mixed last week as gold, silver, and natural gas were higher, but oil, copper, platinum, and palladium were lower for the week.
Gold and the stock market seem to be trading out of phase with each other, which should continue to be bullish for gold and gold stocks. While gold was in a sideways trading range from November 2010 to February 2011, the stock market was rallying. Then the stock market made a top in February 2011 and has been in a consolidation mode since. Gold has now broken out of its consolidation range since November 2010, but the stock market has yet to break to new highs. If gold continues to make new highs and the stock market remains in a trading range I would expect money flow into the gold sector to accelerate to chase its gains. On the chart below gold displayed some bullish technical action last week by testing the trading range, bouncing off of it, and closing right at the highs of the week.
Silver continued its breathtaking move higher last week up another 5% for the week. Silver traders are caught in a perplexing situation right now where they don’t want to be caught in a big correction in silver coming off of this parabolic move. But at the same time they don’t want to surrender their positions and watch silver continue to blast higher. The simple fact is it’s near impossible to predict tops in a market, especially markets that are moving at a parabolic rate higher.
I discussed in a previous article that it would be rare for silver to make a major top independent of gold, since they tend to trade in the same direction. Silver just tends to amplify gold’s gains and its corrections. Since gold is only starting to break out now and move to new highs, and is not excessively overbought, it’s likely still possible silver has more room to run for this current move. That of course doesn’t mean silver can’t pull back a few bucks at any time to rebalance sentiment before it pushes higher.
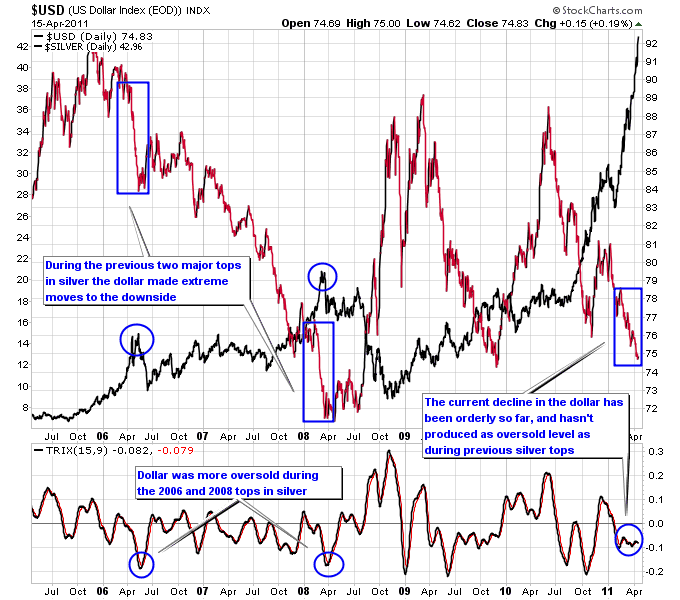
The dollar also isn’t near the same oversold extreme level it reached during the 2006 and 2008 tops in silver. The next chart shows the weekly TRIX momentum indicator with the 2006 and 2008 tops in silver circled on the chart. Notice how the TRIX indicated a more oversold level for the dollar in 2006 and 2008 than exists today. Also the decline in the dollar so far has been steady, but in 2006 and 2008 the dollar really started to move hard to the downside before it found a real bottom, which produced a top in silver.

