When investing in the gold sector one of the most frustrating experiences you can have is watching gold outperform the gold stocks in your portfolio. Investors flock to gold stocks to leverage the returns in gold, not underperform gold. The idea is that a rising gold price produces bigger profits for gold producers, and the market rewards increased profits with higher share prices. So when gold investors take on the elevated risk of buying gold stocks, they want to see their gold stocks outperform the price of gold when gold is rising.
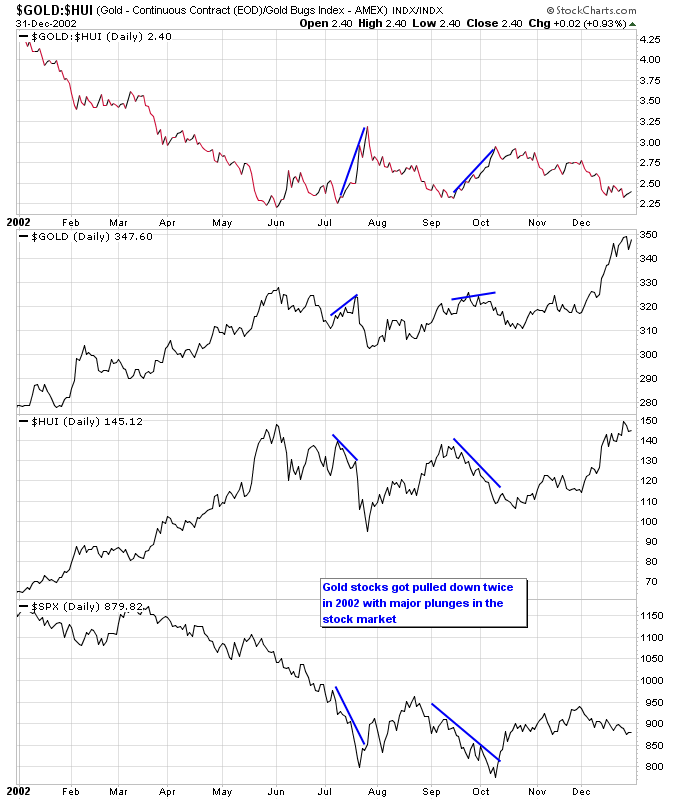
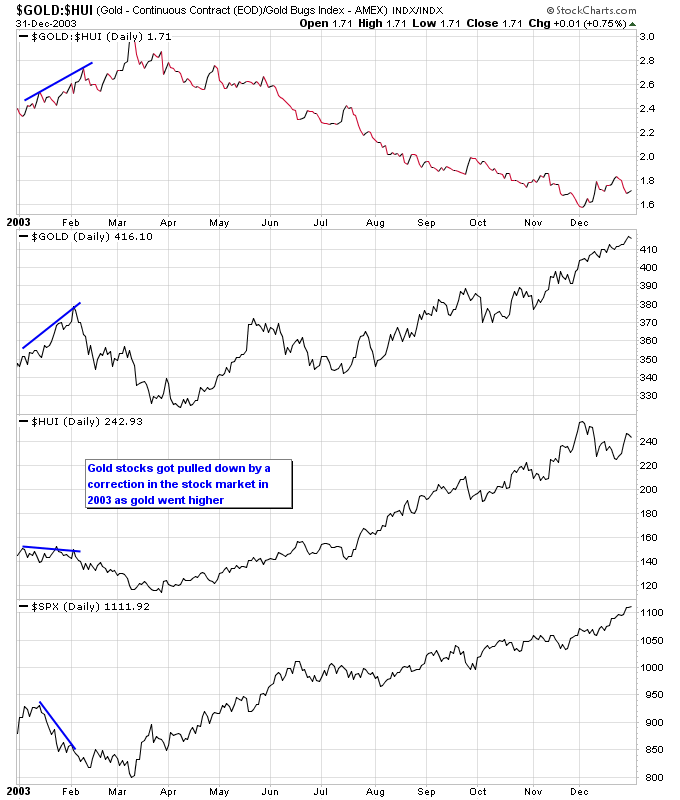
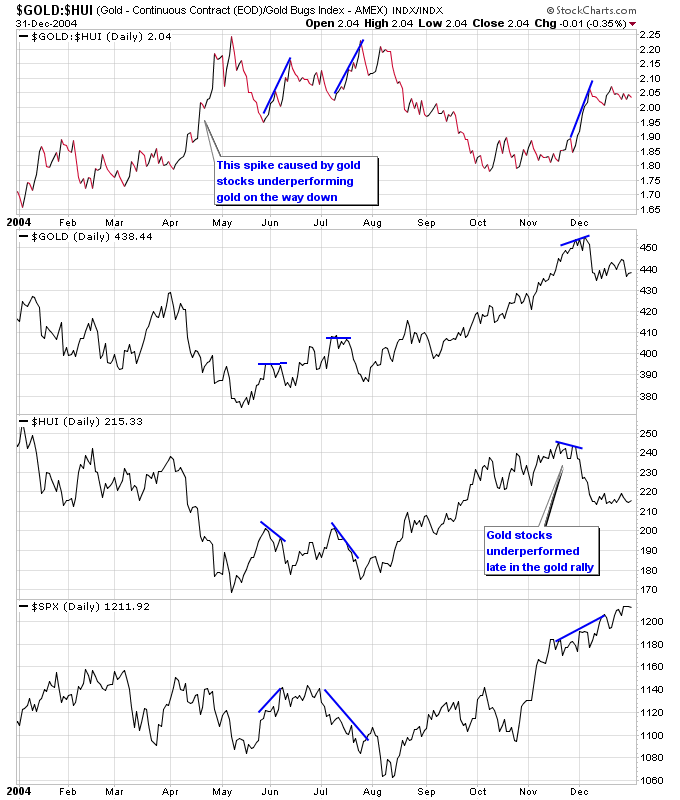
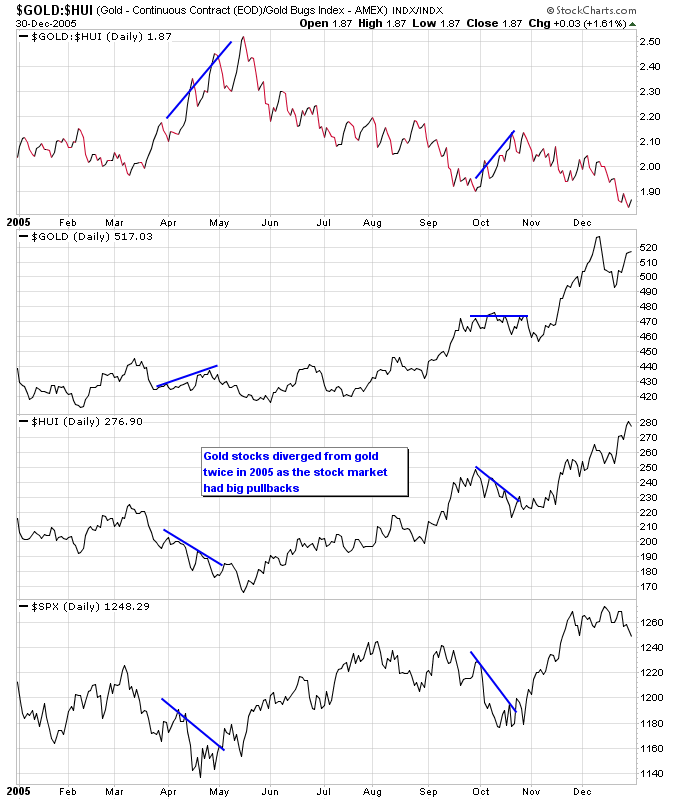
When gold stocks underperform gold it is often taken as a sign that gold is about to correct. Gold investors have blamed general stock market weakness in the past on the failure of gold stocks to leverage gold. They are stocks after all and sometimes the market throws the baby out with the bathwater, and sells gold stocks even when the price of gold is still holding up. In the charts below I’m plotting the Gold to HUI ratio to get a visual look at the times gold outperformed gold stocks. Those events are identified by sharp moves higher in the Gold to HUI ratio. Underneath the Gold to HUI ratio is a chart of gold, the HUI, and the S&P 500. This gives a look at what gold, gold stocks, and the stock market were all doing at the times that gold has outperformed gold stocks.
2002
In 2002 gold stocks underperformed gold during two periods that also occurred during major stock market corrections. Each of those corrections caused gold to experience a pullback as well.
2003
In early 2003 gold rallied while gold stocks pulled back along with the rest of the stock market. Gold finally succumbed to the weakness itself and had a correction. During the rest of the year gold stocks outperformed gold, which caused the Gold to HUI ratio to grind lower.
2004
During 2004 gold stocks had one pullback where the stock market was still moving higher along with gold. Gold stocks had another pullback when stocks corrected and gold was flat. At the end of the major gold rally in 2004 gold stocks showed some weakness (which was unrelated to the stock market which was still rising). This weakness in gold stocks ended up providing a clue that the gold rally was about to suffer a correction.
2005
In 2005 gold stocks were pulled down on two occasions where the stock market pulled back and gold held stable.
2006
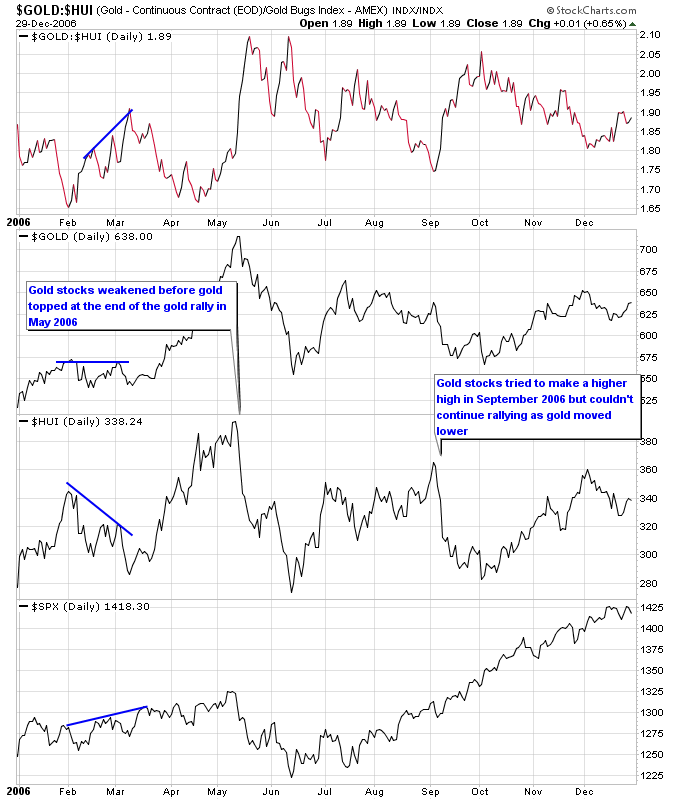
During 2006 gold stocks had a pullback early in the year when gold stayed relatively flat. The stock market at that time was relatively flat as well, so gold stocks pulled back more or less independent of the two. As gold put in an important top in May 2006 gold stocks started displaying some relative weakness against gold, which again provided a clue that the gold rally was about to come to a close. A curious thing happened in September 2006 where gold stocks tried to move higher without gold, likely due to an extremely strong stock market during the second half of 2006. Gold stocks were ultimately unable to trend higher without gold and suffered a pullback with gold.
2007
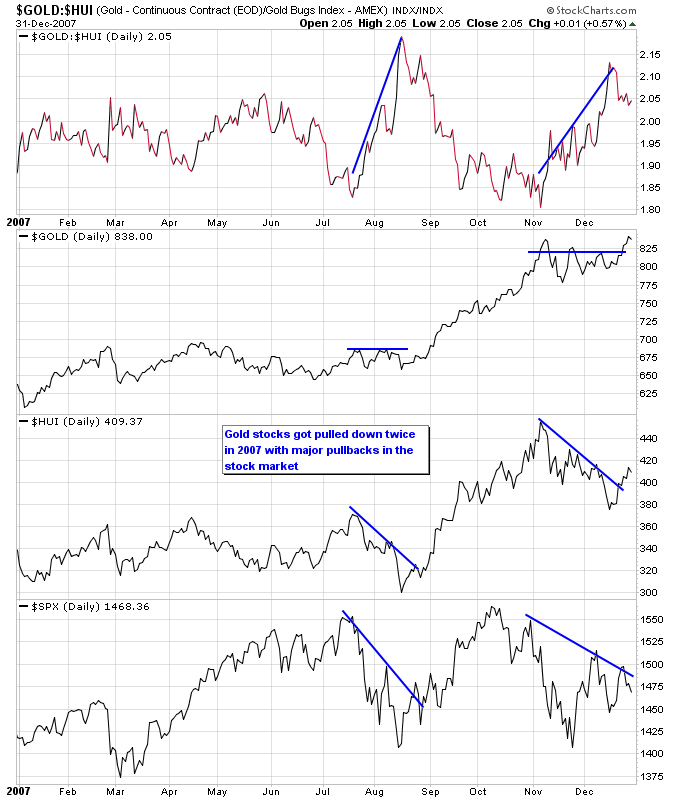
For 2007 the same pattern emerged a couple times where stock market weakness took its toll on gold stocks, even as gold held up well.
2008
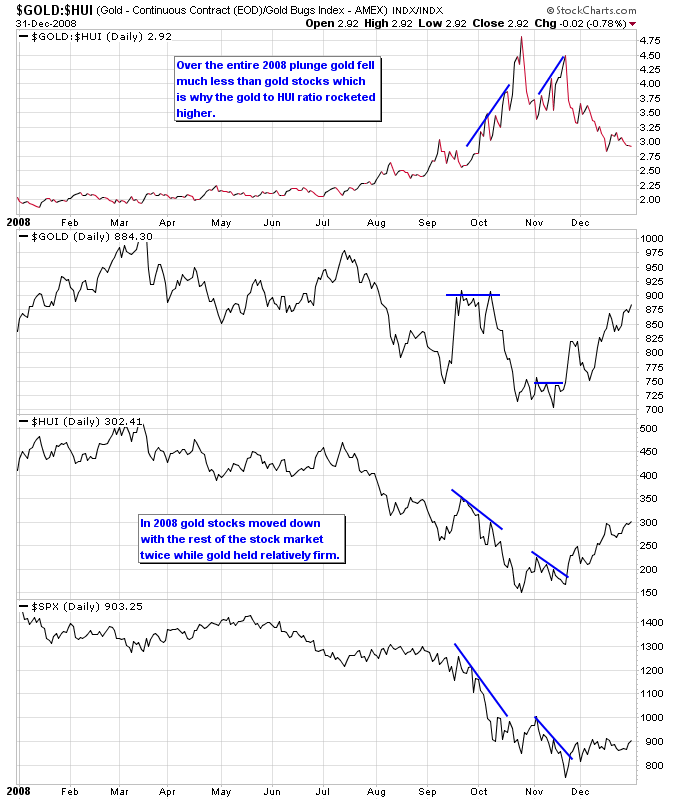
During 2008 of course the stock market panic took its toll on everything, including a crushing blow to gold stocks. There were a couple of periods during the panic where gold held up relatively well, but the avalanche of selling in the general market was too powerful for gold stocks to overcome. The Gold to HUI ratio moved dramatically higher in 2008 as gold stocks suffered a much bigger correction than gold.
2009
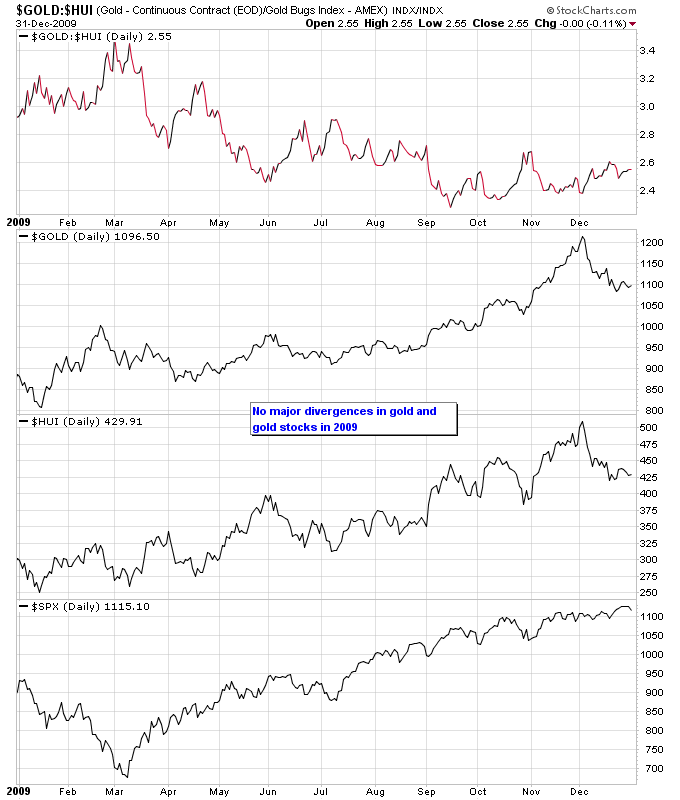
In 2009 there weren’t any notable divergences between gold stocks and gold. On the chart of gold and the HUI the higher highs and higher lows for each were in good synchronization with each other.
2010
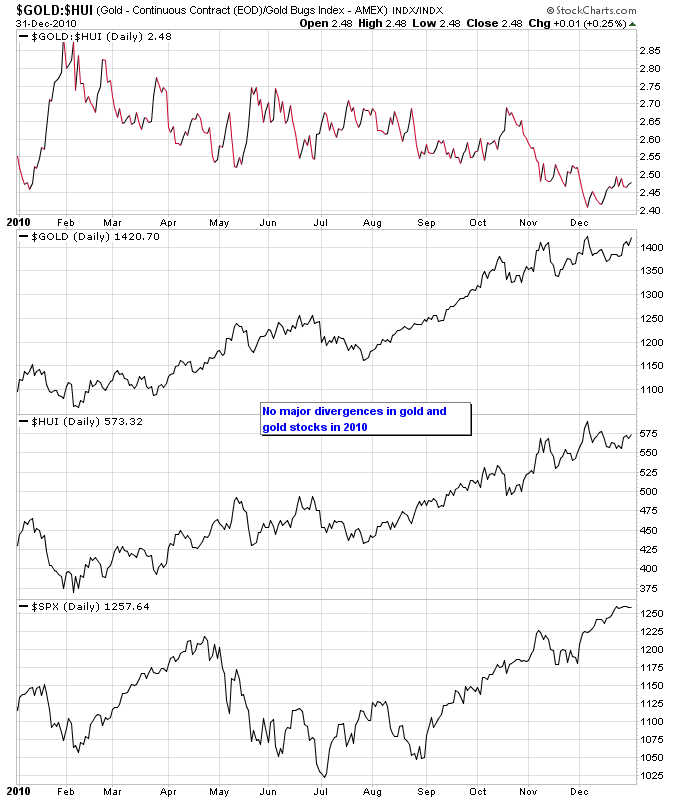
Similar to 2009, in 2010 gold stocks and gold traded in lockstep with each other.
2011
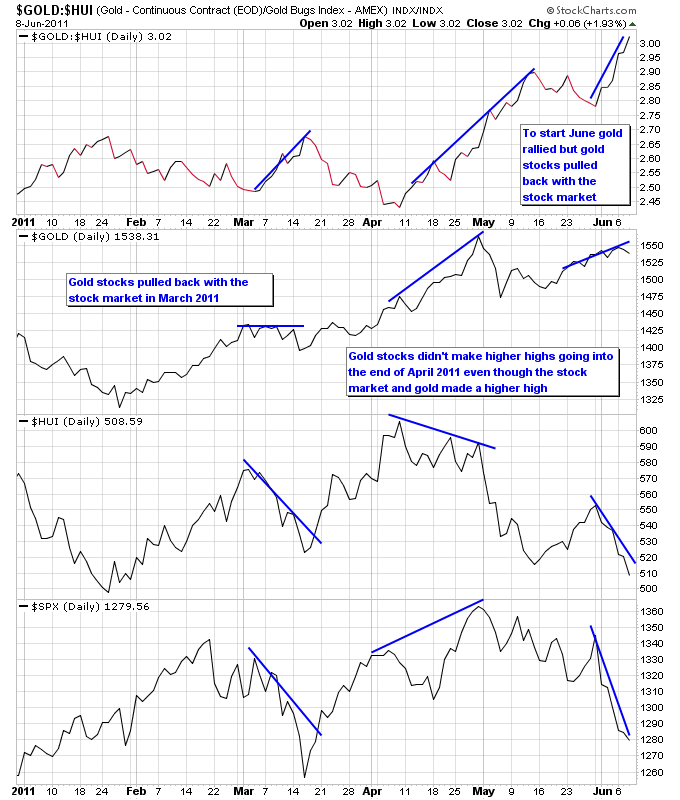
This year in March gold stocks got hit along with the stock market, while gold remained relatively stable. At the end of April, gold and the stock market made a higher high but gold stocks made lower highs during the month. This weakness in gold stocks ended up being a good indicator for the pullback in gold to start May. Gold started making higher highs to start June but gold stocks have pulled back along with the stock market.
The charts above seem to validate two commonly observed phenomena regarding gold stocks: 1) During big stock market corrections, gold stocks are more vulnerable to being pulled down with the rest of the stock market and 2) Gold stocks have exhibited weakness relative to gold at the end of major gold rallies. The first theme seems to occur fairly regularly as panic in the stock market makes its way even into the gold sector. Gold itself has shown a tendency to pullback during these major stock corrections as well. Even though the second theme has occurred a few times I wouldn’t expect it to be the normal case most of the time. There’s certainly a chance in the future that gold stocks could become severely overbought relative to gold at the end of major gold moves, as irrational exuberance in the gold sector could lead to excessive speculation in gold stocks. Especially as the gold bull market progresses and entices more speculative capital from investors.
Finally it is clearly evident when looking back at the charts that gold stocks are taking their cue from the price of gold, even though their charts diverge every so often as market conditions change. This was most prominently on display during 2008 as gold stocks were among the first sectors to recover after the stock market panic, due to the price of gold holding up better than any other asset class. As long as gold’s consistent long term trend remains higher, gold stocks should be able to recover from losses driven by selling in the overall stock market.
