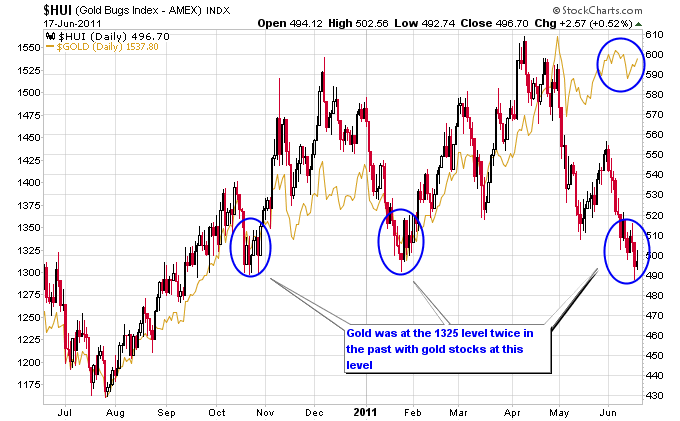
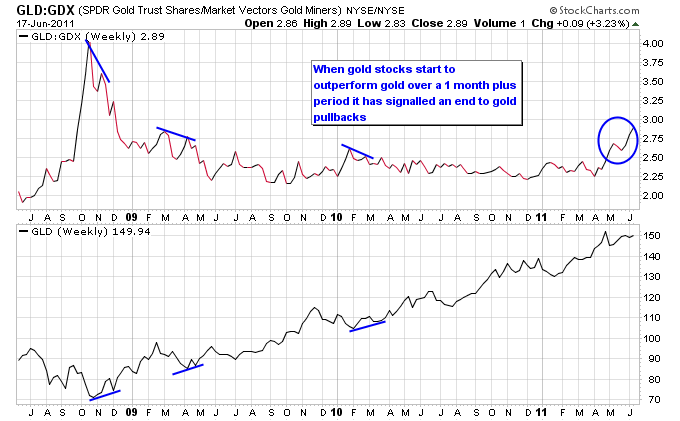
Gold stocks continued to lose ground last week and have now hit the same level they were at in September 2010. Gold however was marginally higher last week and is still holding above its May 2011 lows. The divergence between gold and gold stocks is clearly visible on the next chart:
I recently wrote a piece discussing gold and gold stock divergences over the past decade during this bull market in gold. Most often gold stocks diverge from gold when selling in the general stock market spills over into the gold stocks. Gold however doesn’t usually escape stock market sell-offs completely unharmed. It has tended to end up selling off as well, even though initially it might have held up while the stock market went lower.
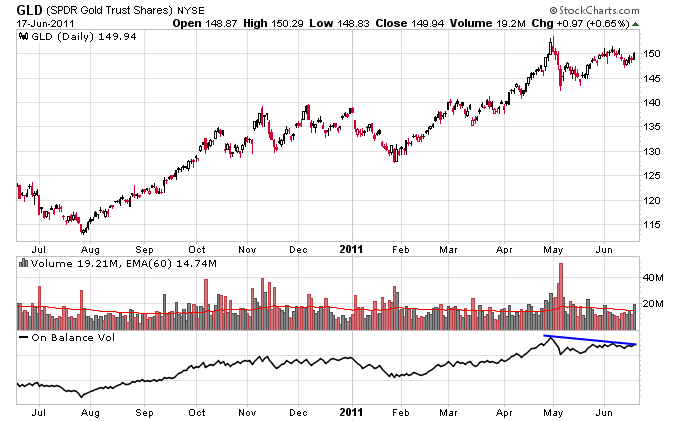
Buying pressure as measured by on balance volume in the GLD ETF still hasn’t exceeded the April high. If this indicator fails to make a new high in the near term it’s less likely gold will as well.
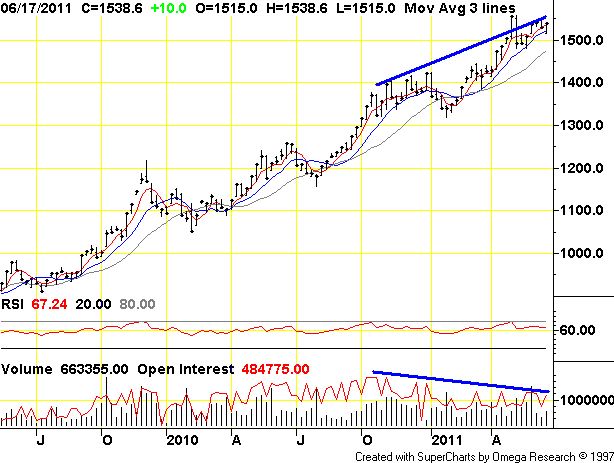
Another negative sign for gold is that price has been rising with falling open interest. On the chart below you can see that since October 2010 the price of gold has risen while open interest has fallen. This typically signals a weakening market and goes along with the declining buying pressure in GLD.
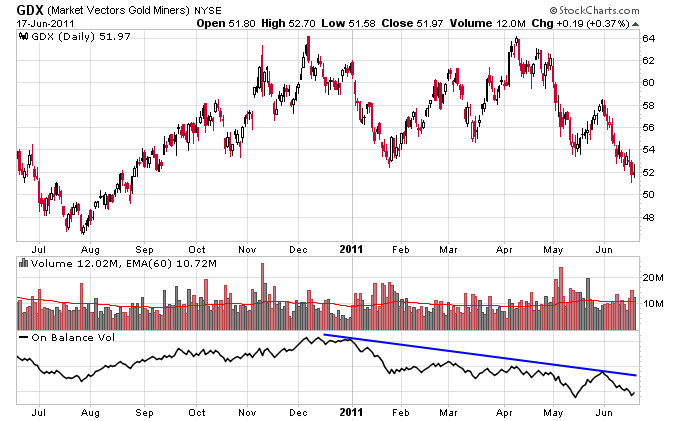
A pickup in buying pressure in the gold stocks would be a good indicator that the market views gold stocks as cheap compared to gold. Currently buying pressure is still trending lower for gold stocks, but it is slightly off of its May low.
Another good indicator for an end to a pullback in gold is when gold stocks start to outperform gold again. On the chart below we would want to see a lower high form once again on the GLD to GDX ratio, which isn’t close to happening quite yet.
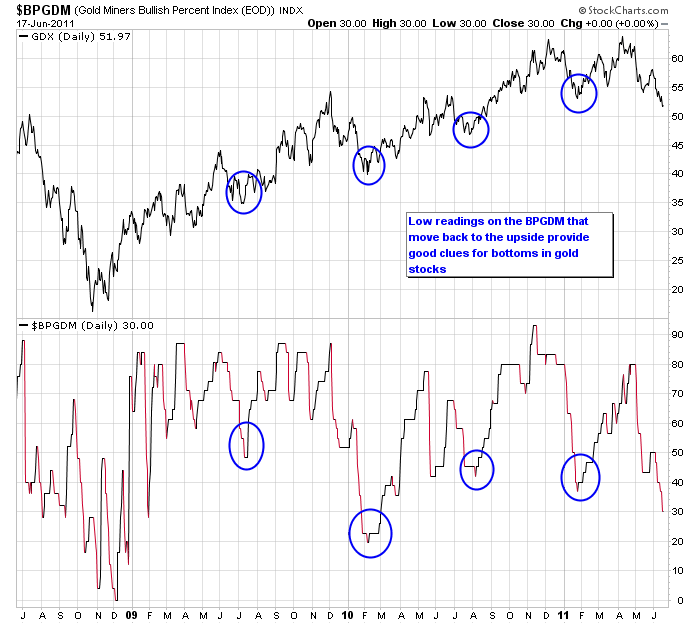
One final indicator that is useful is the Bullish Percent Gold Miners Index, which measures market breadth. When this indicator bounces from extreme low readings, indicating deeply oversold gold stocks, then it’s more certain that the bottom in gold and gold stocks is in.
