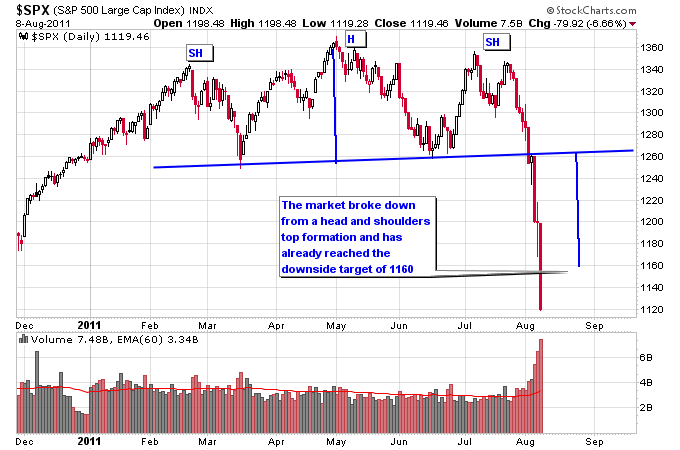
Just six trading days ago the S&P 500 traded above 1300, and now it looks quite likely the S&P will trade below 1100. All told a huge amount of wealth has been wiped out of the S&P 500 in a very short period of time. Looking at a daily chart of the S&P 500 the downside target of the head and shoulders formation that formed the former trading range for 2011 was 1160 (this target is achieved by taking the height of the head from the neckline, which is 100 points, and subtracting that from the neckline). The panic selling has already blown past that target.
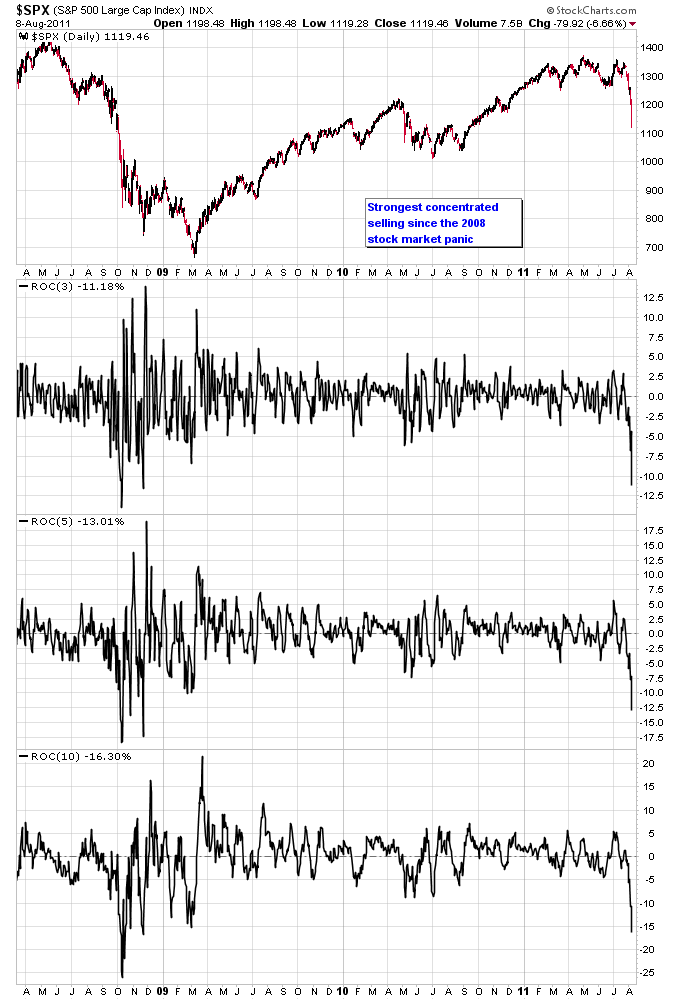
The next chart takes a look at the magnitude of the recent selloff using a daily rate of change indicator in 3-day, 5-day, and 10-day periods. Notice how this selloff is by far the strongest since the cyclical bull market was launched in March 2009. The only comparable selloffs to the current one were the strongest selling during the stock market panic in 2008.
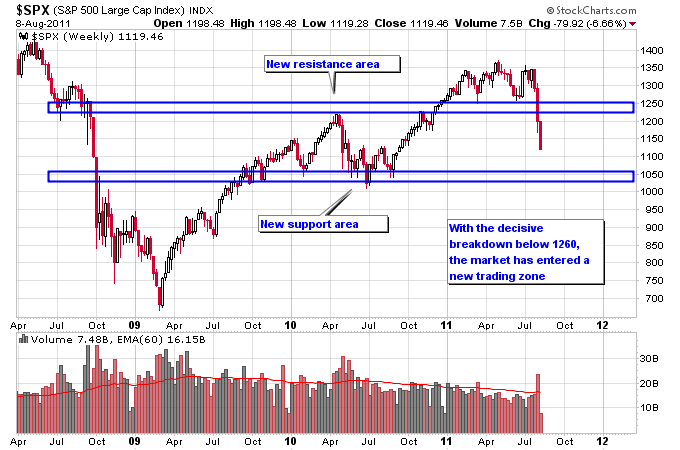
With the breakdown below 1260, the S&P 500 is now back in the trading range it occupied from late 2009 until late 2010. Resistance lies from 1240-1260 while support ranges from 1040-1060. It’s likely the market will consolidate in this area for a long period of time before making its next move, as it works off the oversold condition from this recent massive selloff.
This recent market top looks similar on the chart to what happened back in 2007 where the market made a high at 1576 and dove 300 points before hitting a short term bottom. The market then took about 6 months to work off that oversold condition. It bounced all the way to 1440 where it ran up against former support that turned into resistance, and also the 30-week moving average which had turned downward. Once the market failed at that 1440 level the Stage 4 downtrend was confirmed and in another few months the stock market panic ensued. The key thing to note was that the market downtrend was confirmed before the panic really started.
The 1260 area and the 30-week moving average will be two good indicators to watch as the market potentially switches from a bull to bear market. A bear market would be confirmed by a failure to retake 1260 and a failure of the market to trade back above the 30-week moving average.


