The bears suffered a face-ripper rally over the last couple weeks during the biggest short term rally the market has seen all year. When looking at why this rally occurred, it was evident by many indicators that pessimism was still at high levels as the market attempted to breakdown on October 4th. With pessimism too high on a market that hadn’t really worked off its’ oversold condition, the market was able to reverse sharply and fake out the bears on the downside.
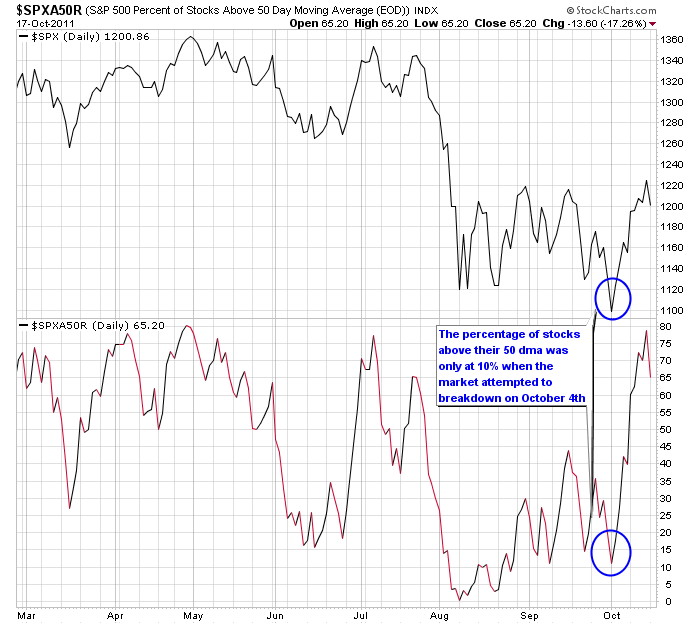
First, check out the percentage of stocks in the S&P 500 that were above the 50 day moving average leading into the action on October 4th. The percentage was only at approximately 10% as the market attempted to breakdown out of the trading range. This is still an extremely oversold level and made it difficult for the bears to get the next downleg they were looking for.
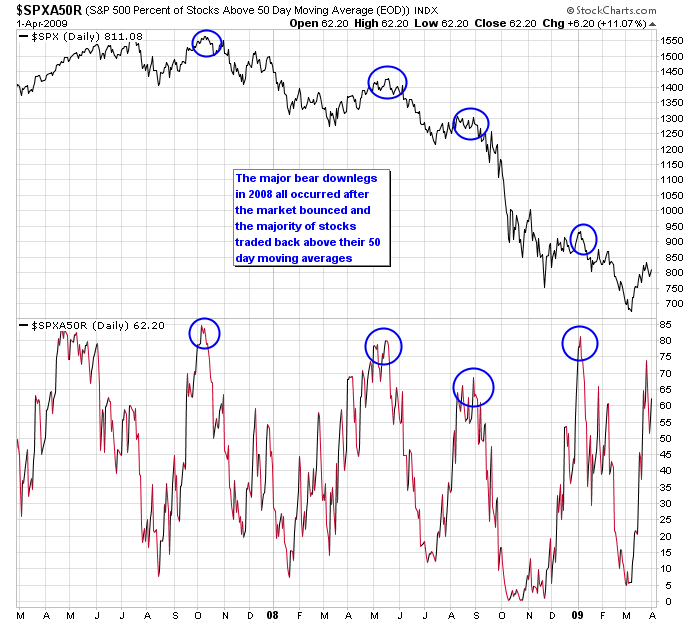
Looking back at the bear market in 2008, each of the major bear downlegs occurred with the percentage of stocks in the S&P 500 above the 50 day moving average at a level of at least 60%, and usually closer to 80%. This helps explain why the market was unable to break to new lows on October 4th. It still hadn’t really worked off its oversold condition yet from the fall in August.
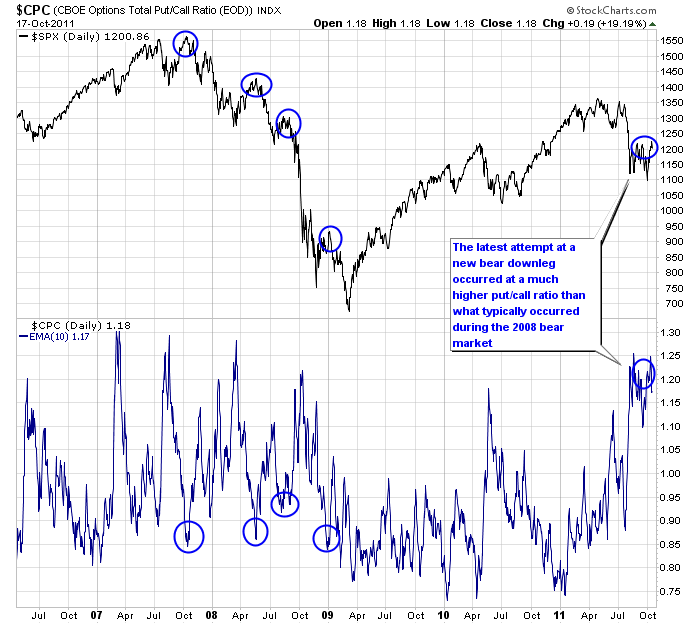
The put/call ratio and the volatility index, two widely used sentiment indicators, were also at extremely bearish levels going into action on October 4th. The 10-day moving average of the put/call ratio is shown in the next chart, and as can be seen it was at a level that was more consistent with market bottoms then tops.
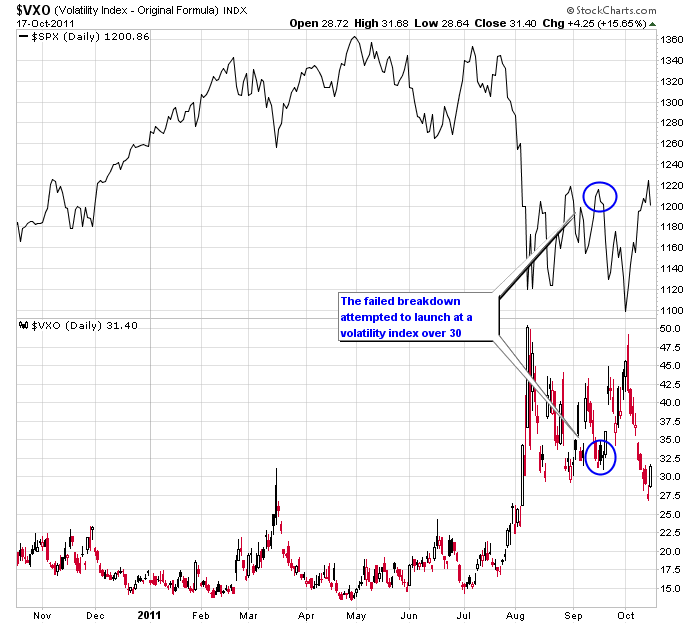
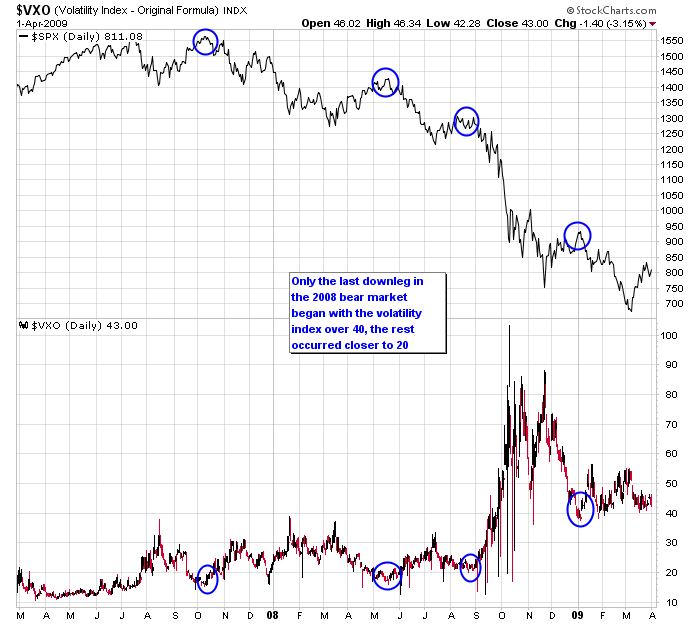
Looking at the Volatility Index (VXO), the latest failed bear downleg attempted to start with a VXO reading over 30.
In 2008 however most of the major bear downlegs occurred with a VXO reading closer to 20. The last bear downleg occured with the VXO over 40 but this was after the heart of the meldown that pushed the index over 40 for multiple months.
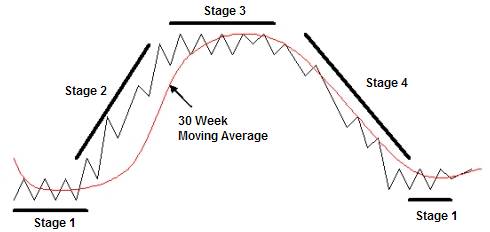
The bulls still have a lot of work to do however to turn this market around. Most world stock indices, individual market sectors, and commodities are in a Stage 4 trend now. This means they are declining on a weekly chart below their 30-week moving average. A Stage 4 trend is the buy and holder’s nightmare, and when a large percentage of the market has transitioned into a Stage 4 it means the market is not healthy.
The last sector of the market to remain in a Stage 2 trend has been select large cap tech stocks, and most notably the triforce of AAPL, IBM, and AMZN. Back in August I alluded to the fact that these powerhouses would be key to a rebound in the market. I stated:
“So if you take the optimistic side of the trade and think that we go up and retest 1260 from here, then the market is going to need leaders to follow on the way back up. Fortunately some of the market leaders since 2009, stocks such as AAPL, IBM, and AMZN, haven’t taken as much technical damage as the rest of the market. If the market was to regain enough footing for a sustainable bounce those stocks would be expected to re-emerge as market leaders.”
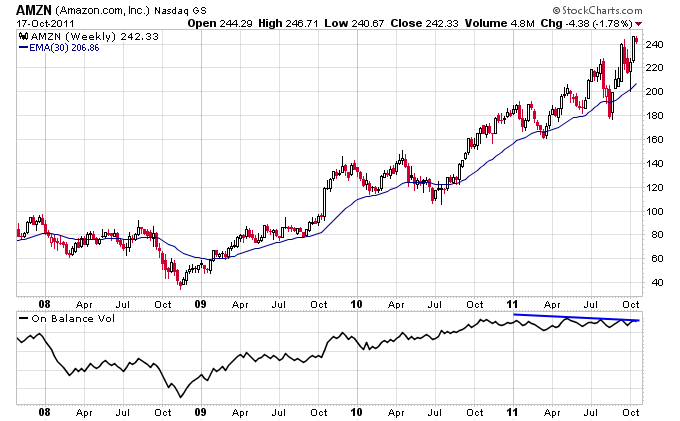
All three stocks have rallied nicely off of that October 4th low, which has helped the bullish case since then. One thing that doesn’t look good for these leaders though is the lackluster volume that has accompanied their move higher this year. The next few charts show that the On Balance Volume (OBV) in each of these stocks has failed to confirm their trend higher. This divergence can sometimes indicate a weakening trend as buying pressure isn’t being sustained.
The same lack of buying pressure can be seen in the Nasdaq 100 as represented by QQQ. The OBV has actually declined all year in QQQ.
The bulls at a minimum are going to need more stocks to repair their damaged chart patterns to sustain this rally higher. Looking further down the totem pole, former leaders with light damage such as PCLN, CRM, and BIDU could embolden the bulls case if they were to move back to the upside. The bulls could also use a breakout of GOOG and INTC out of their multi-month trading ranges. If you check out the volume patterns in each of those stocks though you’ll see that they are suffering from a similar lack of buying pressure as the other leading tech stocks.
Chances are the short term war between bears and bulls is going to continue for the immediate future, as there are still a fair number of stocks that are mean-reverting back to the upside as they work off some of the recent technical damage they have sustained. The put/call ratio and VXO shown above are also working off of their overly pessimistic short term levels. But looking longer term, as long as the majority of the market remains in a structural Stage 4 downtrend, the bear market will remain intact. The bulls need their three leaders to remain in Stage 2 uptrends, and they also need to broaden their leadership for the market to transition back into a bull market.
