Even though this summer was a sentiment wasteland for the precious metals markets, right now feels like a close second. After rallying strongly in August and September the metals have declined for almost 3 months now culminating in a recent smash down. And it feels especially worse since the reaction of gold and silver to the open-ended $85 billion per month quantitative easing announcement from Ben Bernanke has been the opposite of what most would expect.
Seeing through the negativity though the situation is better off for the metals than it was 6 months ago. During the summer, gold built a multi-month base in the $1500s which further validated that zone as being a massive support zone. Then the surge higher off of that base has created a big positive divergence in momentum that often precedes a major move higher in price. Even if gold were to drop back into the $1500s, the divergence in momentum should still be in place, and technicians will undoubtedly pick up on that fact if a bunch of demand comes rushing back into the gold market.
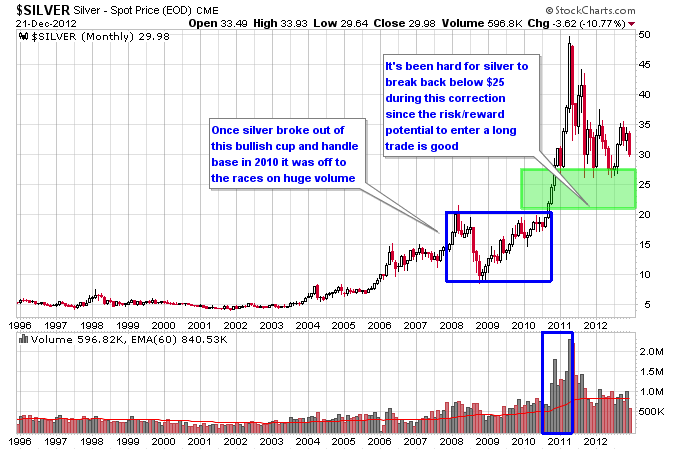
Silver looks similar to gold except the positive divergence in momentum is larger and extends back to the start of 2012. This could be a sign of even more underlying strength in silver than in gold. Notice that just like gold, there’s a bunch of hammer candlesticks over the last 2 years once silver breaks below a certain level. This reinforces the supply and demand dynamics at that level (which is about $27.50 on silver) as strong support. Buyers were able to overwhelm sellers repeatedly once those levels were attempted to be breached to the downside for both metals.
Back in 2011 I postulated that it would be hard for silver to break $25 since the entry point on that trade would be phenomenal for anyone wanting to enter a long term long position in this ongoing secular bull market. The reason was it took silver almost three years to build a base at the $20 level and then it broke out of that base on huge volume. So the closer silver got to $25 the better the risk/reward of the trade for someone wanting to buy a pullback, and have strong support at $20 for downside risk. Since silver is likely still in a secular bull market that would give the trade 20% or so risk to the downside, which is pretty good considering the upside potential could be much higher. So I assumed that $25 would be a good level of support for silver as it entered a new trading range on the correction from $50.
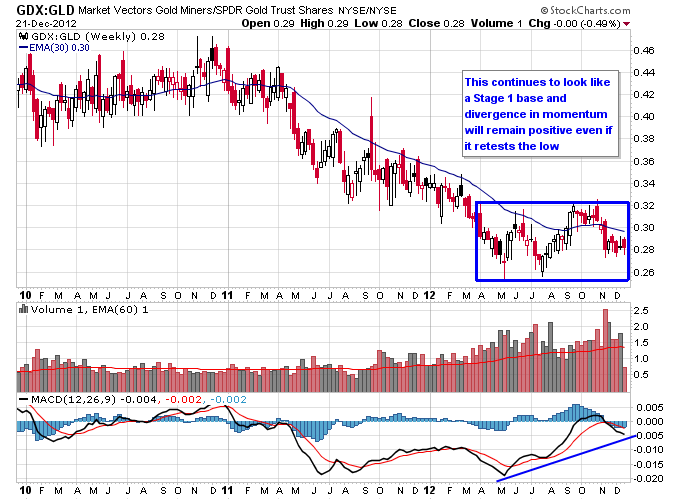
Mining stocks are continuing to demonstrate that they are in the later throes of this ongoing correction in the metals. Back during the summer, almost every mining stock was trading at its lows for the year, or close to them. Now the situation is mixed across the mining space, which indicates some underlying strength. Some mining stocks, such as AEM and FNV, are barely off of recent highs. Others are about at the mid range between their summer low and their September high, such as AUY, HL, and KGC. And some mining stocks have made new lows below their summer lows. Due to more mining stocks holding above their summer lows the GDX to GLD ratio continues to form a Stage 1 base with positive divergence in momentum. And this continues to be significant since major rallies in gold usually are accompanied by outperformance by miners.
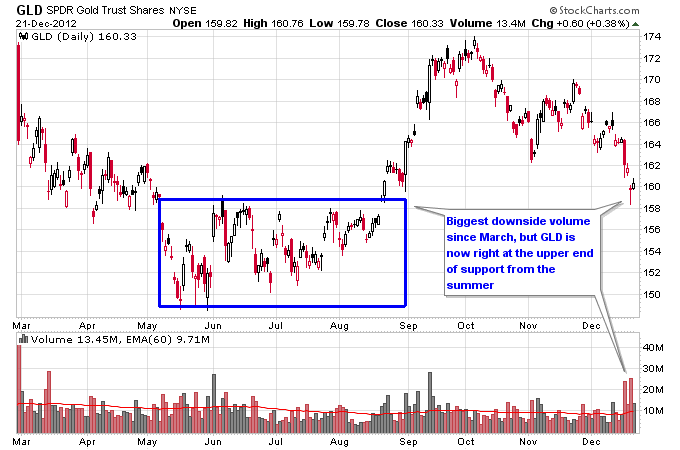
Looking at the short term picture, the trading on December 20th looked like possibly an important turning point or maybe the beginning of one. It was definitely a throw in the towel day for many metals bulls (possibly a lot of weak hands) as both the GLD and SLV ETFs saw the biggest downside volume they’ve seen since March. But looking at a daily chart, their emotional distress was causing them to dump their positions right at the upper range of support from the summer. And the miners showed some nice strength last Thursday as almost every mining stock performed better than the metals that day. This often happens towards the bottom of pullbacks in the metals as first the miners get dumped early in the correction, then the metals get dumped and the miners show some divergent strength.
The bottom line is there’s some short term and long term underlying strength to this recent pullback in the metals. Even if the bears can panic the bulls into selling their positions further into support levels, the bulls still have a positive divergence in momentum that has formed over multiple months and demonstrated long term support at lower levels. It isn’t uncommon to see the lower end of a trading range tested one last time before a new rally either.
Connect with me on Twitter: @nextbigtrade
The original article and much more can be found at: https://www.nextbigtrade.com
The views and opinions expressed are for informational purposes only, and should not be considered as investment advice. Please see the disclaimer.


