At any given point in time different markets are at different points in their long term cycles. Markets can be anywhere from just starting a new bull market to late in a parabolic top on the bull side. On the bear side once a market tops it tends to go through either a bear market downtrend or a sideways consolidation that frustrates the bulls for an extended period of time, or a combination of the two. As a longer term trader the goal is to try and determine where the market is in it’s cycle and to get positioned as early as possible to capture the biggest profits.
Two markets that are at very different points in their cycles are gold and Internet stocks. These two markets don’t have anything to do with one another but both are important and have their own following among investors. The key is forgetting about biases towards these markets and focusing on where they are in their long term cycles to determine what, if any, opportunities they hold.
Internet stocks have made a lot of headlines recently because they made huge moves to the upside in 2013. Then they crashed over the last few months. If you go back and look at a long term chart you’ll see how this all unfolded.
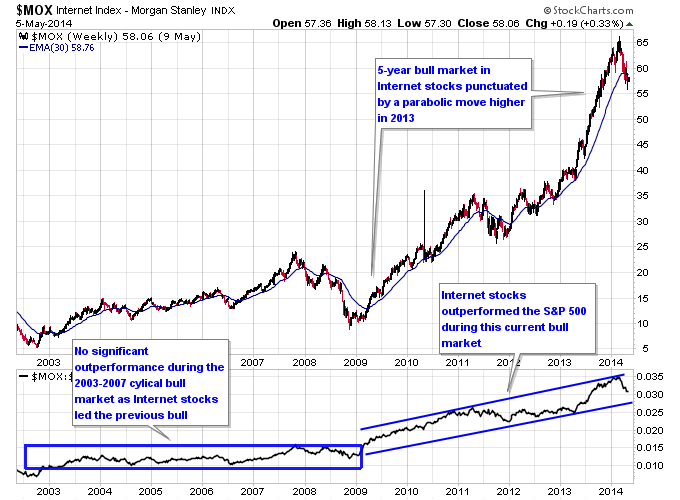
First let’s take a big picture look at where Internet stocks have gone. This chart shows the Morgan Stanley Internet Index going back to it’s induction in 2000, coincidentally at a major top which was the tech bubble. After suffering a disastrous bear market from 2000-2002, Internet stocks embarked on a new bull market along with the bull market in general stocks. But one thing to notice is Internet stocks were not a leading sector during the bull market from 2003-2007. This tends to be typical for a sector that led the previous cycle. Internet stocks barely outperformed the S&P 500 during this period.

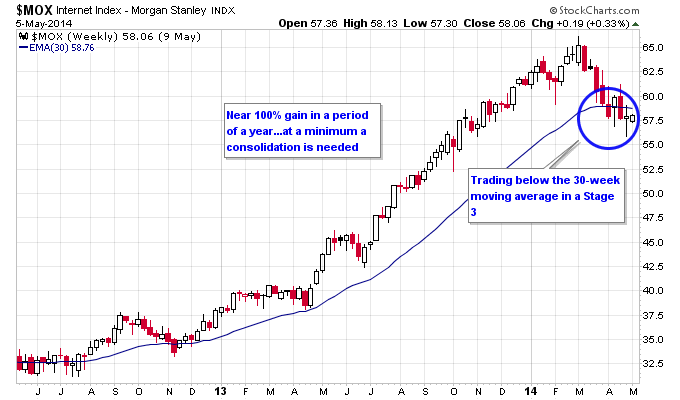
During the next cyclical bull market from 2009 to the present Internet stocks came into their own and started outperforming the rest of the market. The big move came in early 2013 as Internet stocks became one of the dominant sectors in this bull market. With the recent technical damage done to this sector though, the Internet stocks are now in a Stage 3 which is the sign of a potential top or at minimum a consolidation. The 30-week moving average has flattened out and price is now starting to trade below it.

With Internet stocks showing the signs of a potential top, gold is doing the opposite, showing signs of a potential bottom. After crashing in 2013 gold started forming a Stage 1 base as early as April 2013, giving the base 1-year in duration. Gold continues to trade below it’s 30-week moving average, but has recently formed another consolidation zone right underneath this moving average. This is setting up another decision point for gold where gold has the potential to break back above the 30-week moving average and launch a new uptrend. Or it could fail once again at this level and continue its bear market.
There’s a couple of interesting things to point out in this chart for gold. Notice how in early 2013 the candles rejected the 30-week moving average for multiple weeks as evidenced by the wicks failing repeatedly to get above that level. In the current consolidation gold is still failing to get above the moving average, but is showing more evidence so far of rejecting lower prices by printing hammer candlesticks. Momentum was already negative when gold started crashing in early 2013 after it’s tight consolidation. This time momentum is trying to stay positive with the MACD Histogram still above zero. Finally the Bollinger Bands have tightened considerably at this point just like they did during the last consolidation, which indicates a big move is on the horizon.
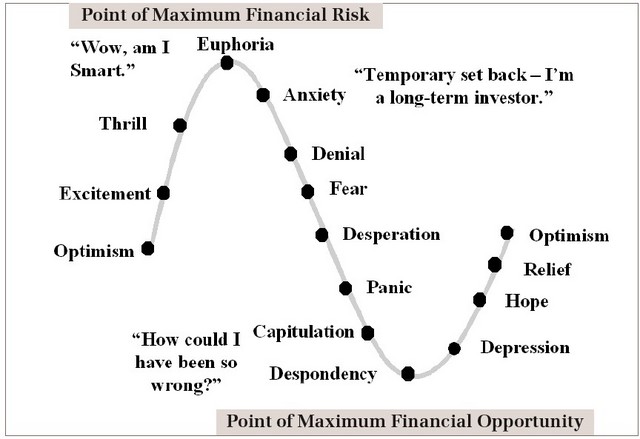
Let’s turn our attention to sentiment in these two markets. Think about the difference in sentiment between Internet stocks and gold over the past couple of years and how it fits well with the price action. Internet stocks had a plethora of IPOs in 2013 that received a lot of hype from the media such as Facebook and Twitter. CNBC covered their IPOs with a fever pitch and covers each of their earnings releases religiously. This produced a lot of excitement and even though these companies had high valuations to begin with their shares continued to soar higher, up to their recent correction.
Checkout the diagram below which shows the typical sentiment cycle a market goes through, and note how it compares well with the recent euphoria in Internet stocks. In reality the euphoria minimized their investment potential, either for a short period of time if this is just a correction in Internet stocks or for a longer period of time if we are seeing a cyclical top. 
Contrast this with gold where gold received not only negative attention in 2013, but in a lot of cases outright derision and ridicule from the media. Gold tends to already attract this sort of attention from the media given that it is an alternative asset class that only goes up when things go bad, at least in the media’s eyes. In reality gold is driven by a number of factors including it’s own supply and demand fundamentals, and trades in its own cycle. The media can hate gold all they want but it’s still going to trade in bull and bear cycles, with or without their approval.
But the key thing to note is not the market, but where it’s at in it’s cycle. Gold clearly fits well into the despondent or depression phase currently, where hardly anyone expects higher prices are possible after a brutal bear market. The question is whether the bear phase is over and how long this depression phase needs to continue. That’s where a framework such as Stage Analysis comes in handy because it simplifies the major swings in price action into a system for determining the birth and death of major cycles.
So clearly Internet stocks and gold are not only different markets, but they are trading at different points in their respective cycles. But the point is it matters more where they are in their respective cycles than what they are as far as the trading opportunities they present.
Connect with me on Twitter: @nextbigtrade
The original article and much more can be found at: https://www.nextbigtrade.com
The views and opinions expressed are for informational purposes only, and should not be considered as investment advice. Please see the disclaimer.
