I’m separating the Stage Analysis Report from a separate weekend report for this week and may do that going forward. This week I’d like to select some charts from different areas and provide some brief comments on them.
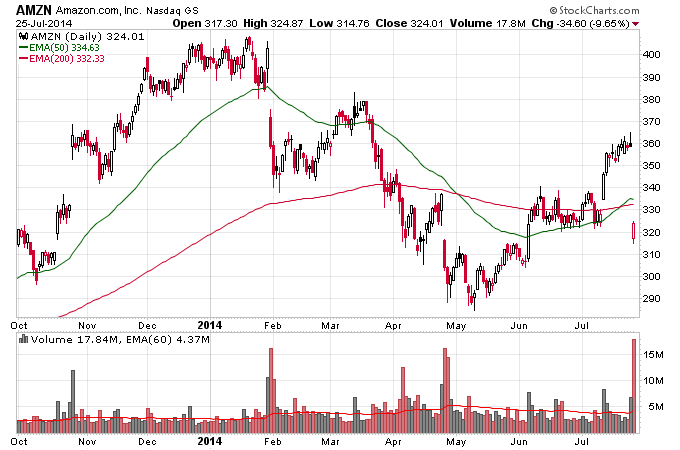
First off one of the shocking events of the week was Amazon’s earnings report. Amazon got punished severely on Friday after forecasting a big loss for its next earnings report. Amazon gapped back below its 200 day moving average on super heavy volume. Right now there’s some fragmented leadership in technology stocks with Facebook and Apple making new highs but there are also plenty of stocks like Amazon acting erratic like they are not going higher anytime soon.
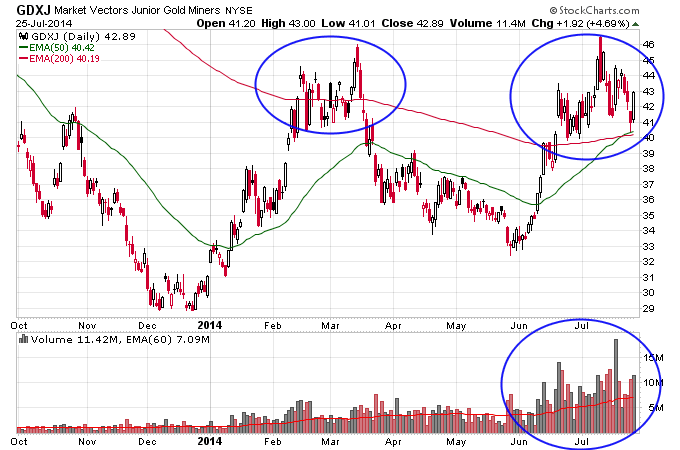
Gold has continued it’s correction off of the $1340 level but had a big up day Friday. Technically the gold stocks look awesome in my opinion as long as they hold the 200 day moving average. Now the 50 day moving average is climbing above the 200, and volume continues to be impressive when gold stocks rally. Notice that the March rally failed at the 200 day moving average. This time GDXJ has been holding that level for a month while gold stocks work off their overbought condition. I think this is super-bullish and the leading gold stocks are acting extremely well too. There are still a lot of skeptics and scaredy-cats in the gold sector too which is music to a bull’s ears.
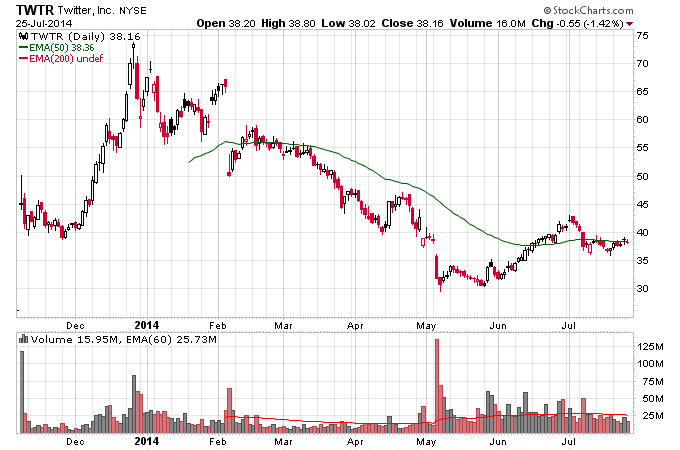
Twitter is an example of how weak the bounce has been since May in some of the former leading stocks. This is a fragmented market unlike 2013 where everything went up strongly. I personally think Twitter is going to go to the single digits, might be a good short candidate in a bear market.
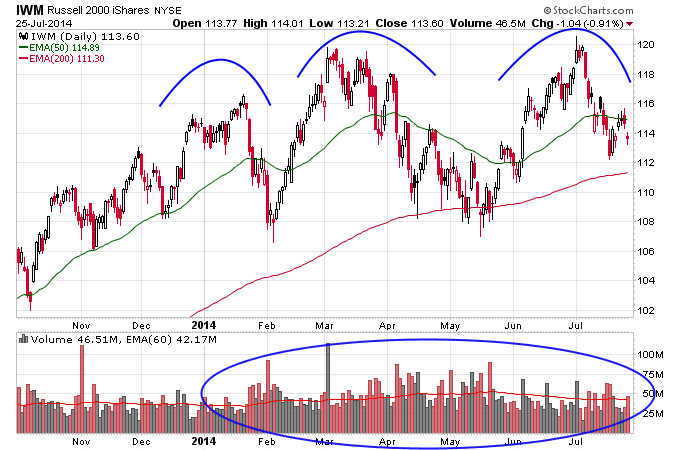
The Russell 2000 has been acting weak all year. This isn’t a definitive bear signal, but something to pay attention too. Just looking at the daily volume you can see a ton of high volume selling days. Plus a head and shoulders pattern is potentially in play here. The 108 level is one to watch if we get a break lower from there IWM would be in a potential head and shoulders breakdown.


