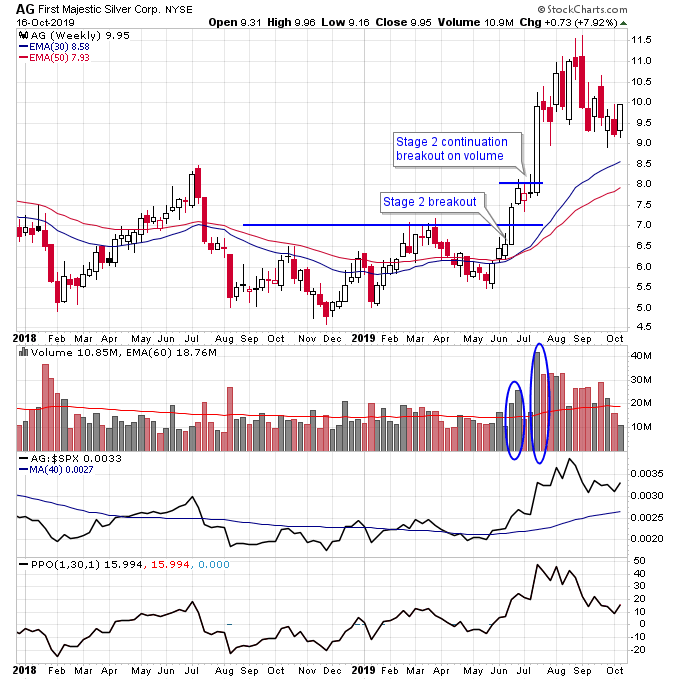
I’m a firm believer that every fundamental piece of information I would ever care about makes it way into the chart. Therefore if I pay attention to the charts I will absorb all the fundamental information anyway. More importantly though I will be following along with what the institutions are doing, and that is the most important thing since their movements affect the markets more than anything else.
When selecting the best stocks in a sector it’s important to learn how to compare charts of stocks against each other. The factors in Stage Analysis that we are concerned with identifying and comparing include:
- Size of volume on the breakout (look at relative volume for the stock and dollar volume (price of stock multiplied times volume). The bigger in both cases the better)
- Overhead resistance
- Outperformance of the S&P 500

From a volume perspective AG had one of the best relative volume and dollar volume breakouts of all the silver stocks. Once it broke out it was also in “blue sky breakout” zone as well with no overhead resistance (in Stage Analysis resistance only goes back 2 years). Finally ever since the breakout AG has been outperforming the S&P 500.
You’ll find that most other silver stocks have overhead resistance and were less explosive on the breakout, which is why AG is one of the best performers in the sector.
Disclosure: I am long AG.
Checkout my new Stage Analysis Screening Tool at: http://screener.nextbigtrade.com
Checkout my trading videos on Youtube
Twitter: @nextbigtrade
The original article and much more can be found at: https://www.nextbigtrade.com
The views and opinions expressed are for informational purposes only, and should not be considered as investment advice. Please see the disclaimer.