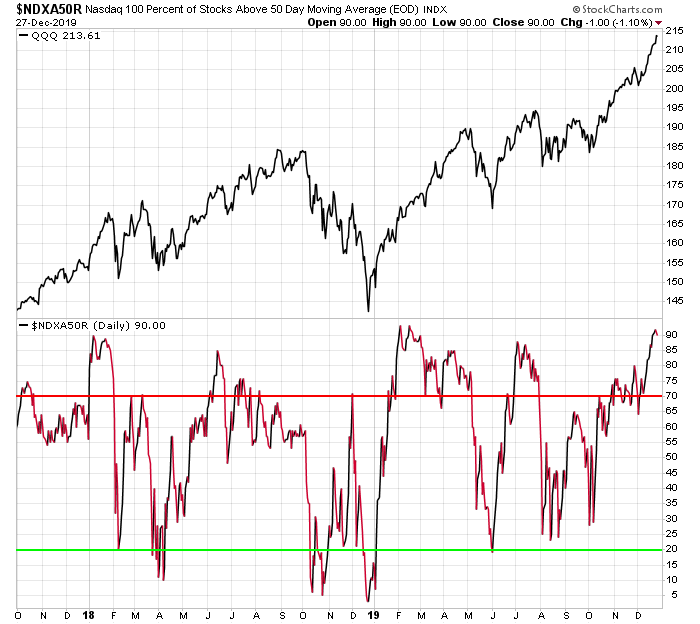
The stock market is up big since October with only two down weeks over the last 3 months. This has produced a condition where the market is now stretched above the 30-week moving average and could be due to correct back down to the moving average. This could occur through a sharp quick correction, or maybe we grind sideways for a longer period of time and let the moving average catch back up.

The percentage of stocks in the Nasdaq 100 above the 50 day moving average is in rare territory at 90% which is a level that the market typically corrects from. The market is also potentially due for another trip below 20% since this tends to occur 2-3 times during a normal market year. In 2019 we only saw one correction which brought the percentage of stocks above the 50 day moving average below 20%, and that occurred back in June over 6 months ago.

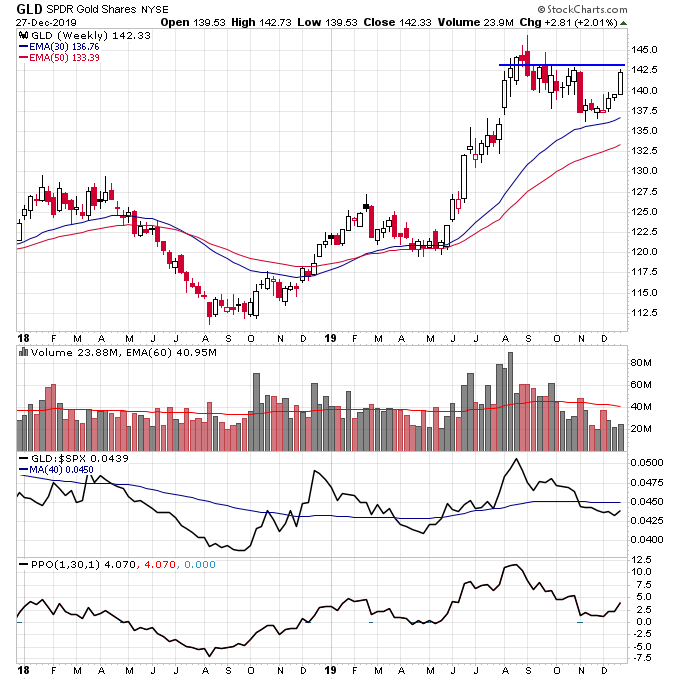
While stocks are stretched and less attractive, gold is looking for a Stage 2 continuation breakout. We’ve already seen big volume come into many silver miners during the week of Christmas. What we need to see now is follow through in the metals, particularly gold which is still trading with below average volume. We need to see gold break out above resistance on an increase in volume to confirm a Stage 2 continuation breakout.
The resistance line is show below, and note how since October while stocks have been flying the volume in GLD has tapered off significantly. This could be set to change if stocks start correcting in early 2020 and gold catches a bid.

Checkout my new Stage Analysis Screening Tool at: http://screener.nextbigtrade.com
Checkout my trading videos on Youtube
Twitter: @nextbigtrade
The original article and much more can be found at: https://www.nextbigtrade.com
The views and opinions expressed are for informational purposes only, and should not be considered as investment advice. Please see the disclaimer.