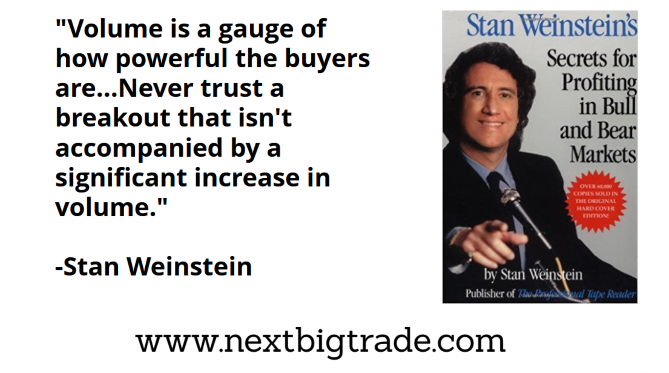
Volume is one of the most important components of Stage Analysis. Volume gives us critical information about supply and demand that we can leverage into making profitable trades. When a market breaks out on a big increase in volume into a Stage 2 uptrend, it signals that demand is significantly outstripping supply. The uptrend will probably have legs to it since buyers are overwhelming sellers and buying at higher prices.

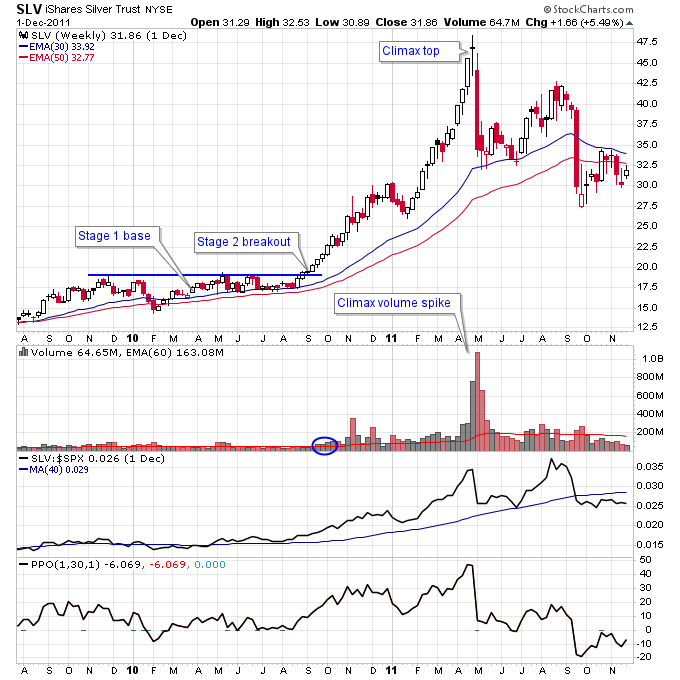
In past silver Stage 2 uptrends volume has dried up after the top signalling buyers are no longer pushing the market higher. In 2011 there was a climax of volume in May and then a big red distribution bar right after it. Then the rally attempt after the climax failed because volume was weak on the rally.
Notice how many weeks of above average volume traded during the rally after the Stage 2 breakout. After the climax top it was a totally different story with far fewer weeks of above average volume, and when there was it was a red distribution bar.

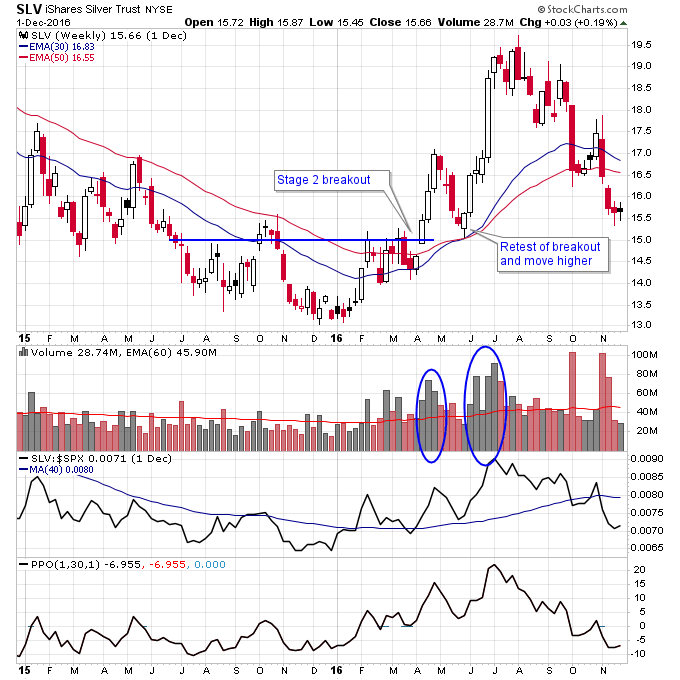
In 2016 after a Stage 2 breakout and retest and move higher on significantly higher volume silver then faded and the accumulation volume faded with it. After the top in August there was no above average weekly volume accumulation (black bars).

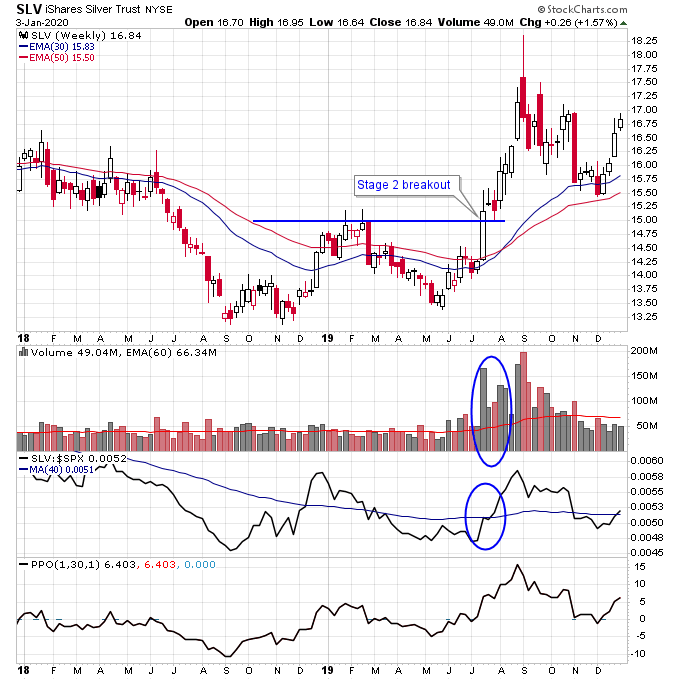
Since September 2019 volume has steadily decreased in silver but it has also held the 30-week moving average in November and December, remaining in a Stage 2 uptrend. Now silver is setup for a potential Stage 2 continuation breakout if we see an increase in volume on the break above resistance around $17.

Checkout my Stage Analysis Screening Tool at: http://screener.nextbigtrade.com
Checkout my trading videos on Youtube
Twitter: @nextbigtrade
The original article and much more can be found at: https://www.nextbigtrade.com
The views and opinions expressed are for informational purposes only, and should not be considered as investment advice. Please see the disclaimer.