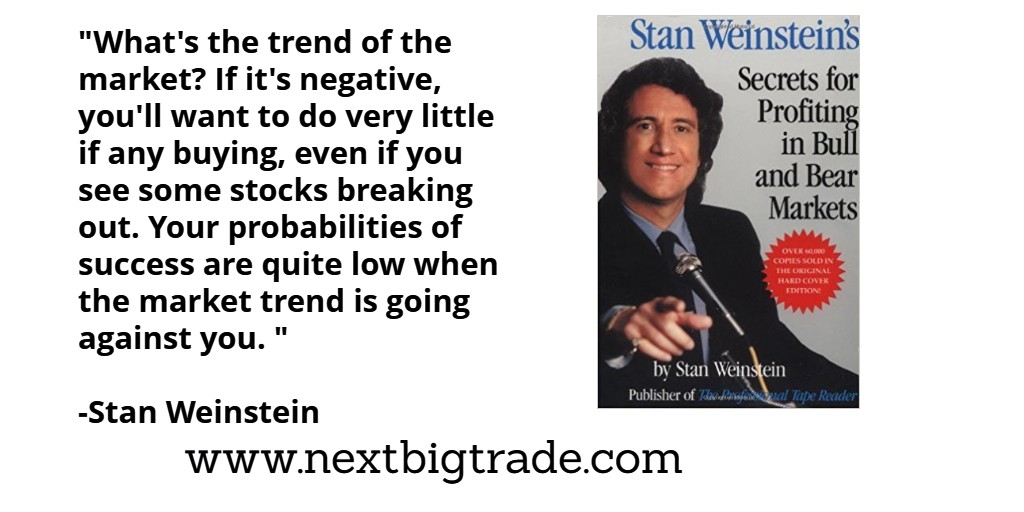
Trying to figure out whether the stock market has bottomed is not a part of the Stage Analysis trading system that I use to trade the market. However the trend of the S&P 500 is a major component of the “Forest To The Trees Approach”, which is a 3-step system to trying to find the best stocks to trade. Step 1 is determining the trend of the S&P 500, as Stan Weinstein says if the trend of the overall market is negative then you want to do very little buying, because the S&P 500 moving lower will affect even the best stocks and hurt their performance.

The S&P 500 is still in a Stage 4 downtrend. But within Stage 4 downtrends are massive counter trend rallies that bring the S&P 500 back up to the 30-week moving average to work off the excessively bearish sentiment that builds up during down-legs. Most people succumb to recency bias when thinking about what’s going on in the stock market. If they perceive a downtrend to “never end” then they will get even more bearish as the downtrend continues going even though in reality they should be getting more bullish in the short term because of counter-rend rallies, and because the lower the market goes it is in effect closer to the bottom.
You can see this in the results below from Twitter polls that Mark Minervini has been conducting for the past month on whether the stock market has bottomed. Notice how the results have gotten even more bearish as the stock market has continued lower, but what they should be doing is getting more bullish because the lower we go means the closer we are to the eventual “bottom”. The results are presented in chronological order from the most recent to the earliest, notice how the latest two are over 70% bearish while earlier most of the results had been in the 60% range.


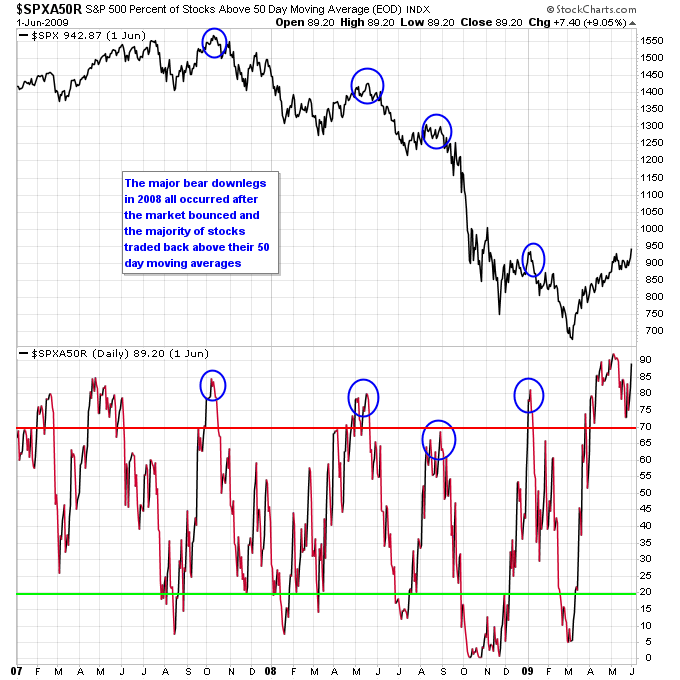
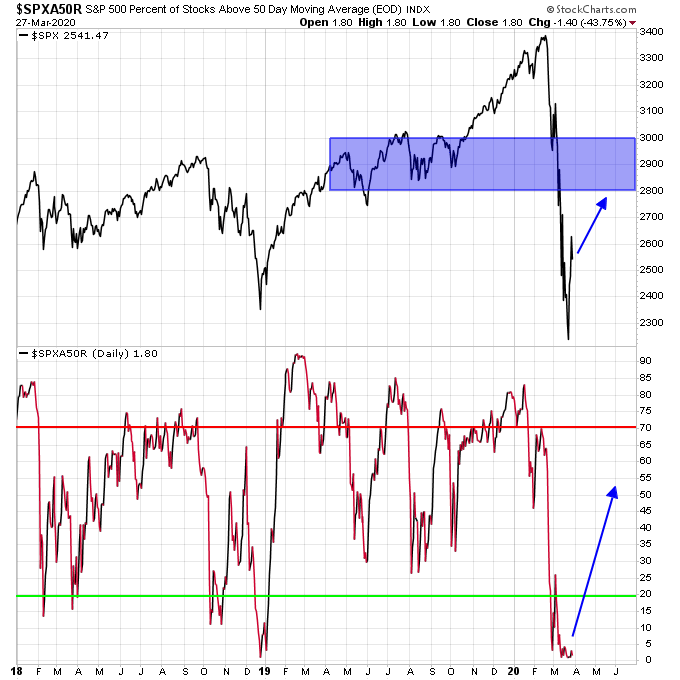
The percentage of stocks in the S&P 500 below the 50-dma is still at an extremely low level, less than 5 percent as of last Friday. If you look at what happened in 2008 the major bear downlegs in that bear market started when the majority of S&P 500 stocks were above the 50-dma, not below it.


So for now in my opinion the higher percentage odds favor the market rallying back to the 30-week MA over the short term to work off the current oversold condition. We should see the percentage of stocks above the 50-dma in the S&P 500 move much higher as well.
Before the recent panic I talked about how the market was overdue to move below 20 percent of stocks in the S&P 500 above the 50-dma since during 2019 we never had a move lower below that threshold, and we typically get at least one each year (see the video below). This recent panic has certainly taken care of that and has cleared the deck from both a sentiment perspective and with regards to the market needing a periodic correction.
Get more info on Stage Analysis or Stan Weinstein’s book
Check out my trading videos on Youtube
Check out my Stage Analysis Screening Tool at: http://screener.nextbigtrade.com
Twitter: @nextbigtrade
The original article and much more can be found at: https://www.nextbigtrade.com
The views and opinions expressed are for informational purposes only, and should not be considered as investment advice. Please see the disclaimer.